I noted that I wasn't even on recession watch!
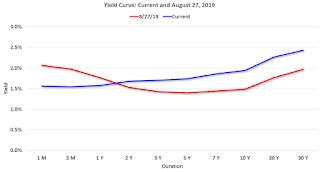
First, here is a graph of the current yield curve, and the yield curve back on August 27, 2019.
 Click on graph for larger image.
The current yield curve (blue) is upward sloping (longer duration notes and bonds yield more than short term bills and notes).
In August, the yield curve was inverted (red).
However - as I noted in August - the Fed was cutting rates this year.
Source: Daily Treasury Yield Curve Rates
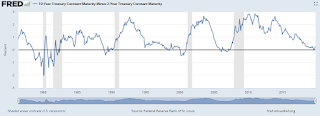
And here is an updated graph of 10-Year Treasury Constant Maturity Minus 2-Year Treasury Constant Maturity from FRED.
 Click here for interactive graph at FRED.
In mid-1998 the spread between the 10 year and the 2 year went slightly negative, and a recession didn't start until 2001 - over 2 1/2 years later. Of course the Fed cut rates in 1998 - just like the current situation.