Overall construction spending decreased in July.
 Click on graph for larger image in new window.
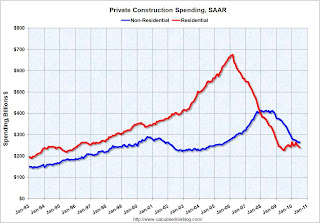
This graph shows private residential and nonresidential construction spending since 1993. Note: nominal dollars, not inflation adjusted.
From the Census Bureau: July 2010 Construction at $805.2 Billion Annual Rate
The U.S. Census Bureau of the Department of Commerce announced today that construction spending during July 2010 was estimated at a seasonally adjusted annual rate of $805.2 billion, 1.0 percent (±1.4%)* below the revised June estimate of $813.1 billion. The July figure is 10.7 percent (±1.8%) below the July 2009 estimate of $901.2 billion.Private residential construction spending has turned down again - after the tax credit expired - and residential investment (RI) will be a drag on Q3 GDP. The "good" news is the overall drag from RI will be much smaller than during 2006, 2007 and 2008.
...
Spending on private construction was at a seasonally adjusted annual rate of $506.4 billion, 0.8 percent (±1.3%)* below the revised June estimate of $510.7 billion. Residential construction was at a seasonally adjusted annual rate of $240.3 billion in July, 2.6 percent (±1.3%) below the revised June estimate of $246.7 billion. Nonresidential construction was at a seasonally adjusted annual rate of $266.1 billion in July, 0.8 percent (±1.3%)* above the revised June estimate of $264.0billion.