Note that all data is Not Seasonally Adjusted (NSA), hence the seasonal pattern.
 Click on graph for larger image in new window.
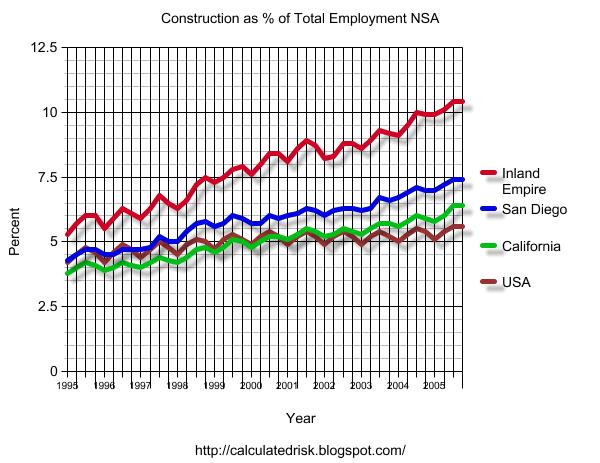
This graph shows construction as a percent of total employment (NSA) for the U.S., California, San Diego and California's Inland Empire.
As much as the U.S. saw an increase in construction employment (as a percent of total employment), California was a little more dependent on construction, San Diego even more - and the Inland Empire heavily dependent on construction employment.
This is construction only. Other construction related jobs probably follow the same pattern: real estate agents, mortgage brokers, inspectors, etc.
Here is the graph from the 2005 post:
 A little different graphics software (it was much hard to use).
Back in 2005, I argued
"California has become more dependent on construction than the rest of the country, and construction has really boomed in San Diego. But San Diego has nothing on the Inland Empire.
I believe that areas like the Inland Empire will suffer the most when housing activity slows."