Click on Graph for larger image.
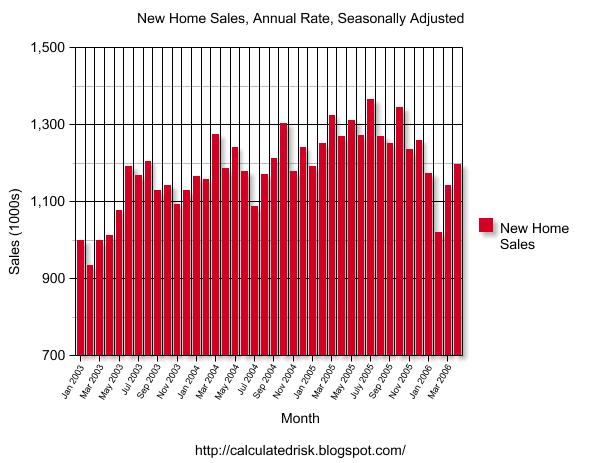
NOTE: The graph starts at 700 thousand units per month to better show monthly variation.
Originally the Census Bureau reported a significant increase in sales for both March and April 2006.

Here is the graph today. The "recovery" in March and April 2006 has been revised away.
I expect the April 2007 sales number to be revised downwards too.
More later today on New Home Sales.