 RSS Feed
 by Calculated Risk on 10/01/2014 08:18:00 AM
Wednesday, October 01, 2014
ADP: Private Employment increased 213,000 in September
Private sector employment increased by 213,000 jobs from August to September according to the August ADP National Employment Report®. ... The report, which is derived from ADP’s actual payroll data, measures the change in total nonfarm private employment each month on a seasonally-adjusted basis.This was slightly above the consensus forecast for 200,000 private sector jobs added in the ADP report.
...
Mark Zandi, chief economist of Moody’s Analytics, said, "Job gains remain strong and steady. The pace of job growth has been remarkably similar for the past several years. Especially encouraging most recently is the increasingly broad base nature of those gains. Nearly all industries and companies of all sizes are adding consistently to payrolls.”
The BLS report for September will be released on Friday.
MBA: Mortgage Applications Decrease Slightly in Latest MBA Weekly Survey
by Calculated Risk on 10/01/2014 07:00:00 AM
From the MBA: Mortgage Applications Decrease Slightly in Latest MBA Weekly Survey
Mortgage applications decreased 0.2 percent from one week earlier, according to data from the Mortgage Bankers Association’s (MBA) Weekly Mortgage Applications Survey for the week ending September 26, 2014. ...
The Refinance Index decreased 0.3 percent from the previous week. The seasonally adjusted Purchase Index remained unchanged from one week earlier. The unadjusted Purchase Index decreased 1 percent compared with the previous week and was 11 percent lower than the same week one year ago. ...
...
The average contract interest rate for 30-year fixed-rate mortgages with conforming loan balances ($417,000 or less) decreased to 4.33 percent from 4.39 percent, with points decreasing to 0.31 from 0.35 (including the origination fee) for 80 percent loan-to-value ratio (LTV) loans.
emphasis added
 Click on graph for larger image.
The first graph shows the refinance index.
The refinance index is down 76% from the levels in May 2013.
Refinance activity is very low this year and will be the lowest since year 2000.
 The second graph shows the MBA mortgage purchase index.
 According to the MBA, the unadjusted purchase index is down about 11% from a year ago.
Tuesday, September 30, 2014
Wednesday: Vehicle Sales, ISM Manufacturing, ADP Employment, Q3 Office Vacancies, Construction Spending
by Calculated Risk on 9/30/2014 08:01:00 PM
Wednesday will be busy! First, from the National Restaurant Association: Restaurant Performance Index Registers August Gain
Driven by stronger same-store sales and customer traffic levels and a more optimistic outlook among restaurant operators, the National Restaurant Association’s Restaurant Performance Index (RPI) posted a solid gain in August. The RPI – a monthly composite index that tracks the health of and outlook for the U.S. restaurant industry – stood at 101.9 in August, up 1.0 percent from July and its first gain in three months. In addition, the RPI stood above 100 for the 18th consecutive month, which signifies expansion in the index of key industry indicators.
“The August gain in the RPI was fueled by stronger same-store sales and customer traffic results, aided by continued improving economic conditions,” said Hudson Riehle, senior vice president of the Research and Knowledge Group for the Association. “Looking forward, restaurant operators remain generally optimistic about continued sales growth, while a majority plans to make a capital expenditure in the next six months. However, operators still report food costs and government among top challenges that continue to negatively affect the operating environment.”
emphasis added
 Click on graph for larger image.
The index increased to 101.9 in August, up from 101.0 in July. (above 100 indicates expansion).
Restaurant spending is discretionary, so even though this is "D-list" data, I like to check it every month. This is a solid reading.
Wednesday:
• At 7:00 AM ET, the Mortgage Bankers Association (MBA) will release the results for the mortgage purchase applications index.
• All day, Light vehicle sales for September. The consensus is for light vehicle sales to decrease to 16.8 million SAAR in September from 17.4 million in August (Seasonally Adjusted Annual Rate).
• 8:15 AM, the ADP Employment Report for September. This report is for private payrolls only (no government). The consensus is for 200,000 payroll jobs added in September, down from 205,000 in August.
• Early, Reis Q3 2014 Office Survey of rents and vacancy rates.
• At 10:00 AM, the ISM Manufacturing Index for September. The consensus is for a decrease to 58.0 from 59.0 in August. The ISM manufacturing index indicated expansion in August at 59.0%. The employment index was at 58.1%, and the new orders index was at 66.7%.
• At 10:00 AM, Construction Spending for August. The consensus is for a 0.5% increase in construction spending.
Fannie Mae: Mortgage Serious Delinquency rate below 2% in August, Lowest since October 2008
by Calculated Risk on 9/30/2014 04:11:00 PM
Fannie Mae reported today that the Single-Family Serious Delinquency rate declined slightly in August to 1.99% from 2.00% in July. The serious delinquency rate is down from 2.61% in August 2013, and this is the lowest level since October 2008.
The Fannie Mae serious delinquency rate peaked in February 2010 at 5.59%.
Freddie Mac has not reported for August yet.
Note: These are mortgage loans that are "three monthly payments or more past due or in foreclosure".
 Click on graph for larger image
The Fannie Mae serious delinquency rate has fallen 0.62 percentage points over the last year, and at that pace the serious delinquency rate will be under 1% in 2016 - although the rate of decline has slowed recently.
Note: The "normal" serious delinquency rate is under 1%.
Maybe serious delinquencies will be close to normal in 2016.
House Prices: Real Prices and Price-to-Rent Ratio decline in July
by Calculated Risk on 9/30/2014 01:44:00 PM
I started 2014 expecting a slowdown in year-over-year (YoY) prices as "For Sale" inventory increases, and the price slowdown is very obvious! The Case-Shiller Composite 20 index was up 6.7% YoY in July; the smallest YoY increase since November 2012 (the National index was up 5.6%, also the slowest YoY increase since November 2012.
I expect YoY prices to slow further over the next several months.
It is also important to look at prices in real terms (inflation adjusted). Case-Shiller, CoreLogic and others report nominal house prices. As an example, if a house price was $200,000 in January 2000, the price would be close to $280,000 today adjusted for inflation (40%). That is why the second graph below is important - this shows "real" prices (adjusted for inflation).
Nominal House Prices
 The first graph shows the monthly Case-Shiller National Index SA, the monthly Case-Shiller Composite 20 SA, and the CoreLogic House Price Indexes (through July) in nominal terms as reported.
In nominal terms, the Case-Shiller National index (SA) is back to February 2005 levels, and the Case-Shiller Composite 20 Index (SA) is back to September 2004 levels, and the CoreLogic index (NSA) is back to February 2005.
Real House Prices
 The second graph shows the same three indexes in real terms (adjusted for inflation using CPI less Shelter). Note: some people use other inflation measures to adjust for real prices.
In real terms, the National index is back to July 2002 levels, the Composite 20 index is back to June 2002, and the CoreLogic index back to March 2003.
In real terms, house prices are back to early '00s levels.
Price-to-Rent
In October 2004, Fed economist John Krainer and researcher Chishen Wei wrote a Fed letter on price to rent ratios: House Prices and Fundamental Value. Kainer and Wei presented a price-to-rent ratio using the OFHEO house price index and the Owners' Equivalent Rent (OER) from the BLS.
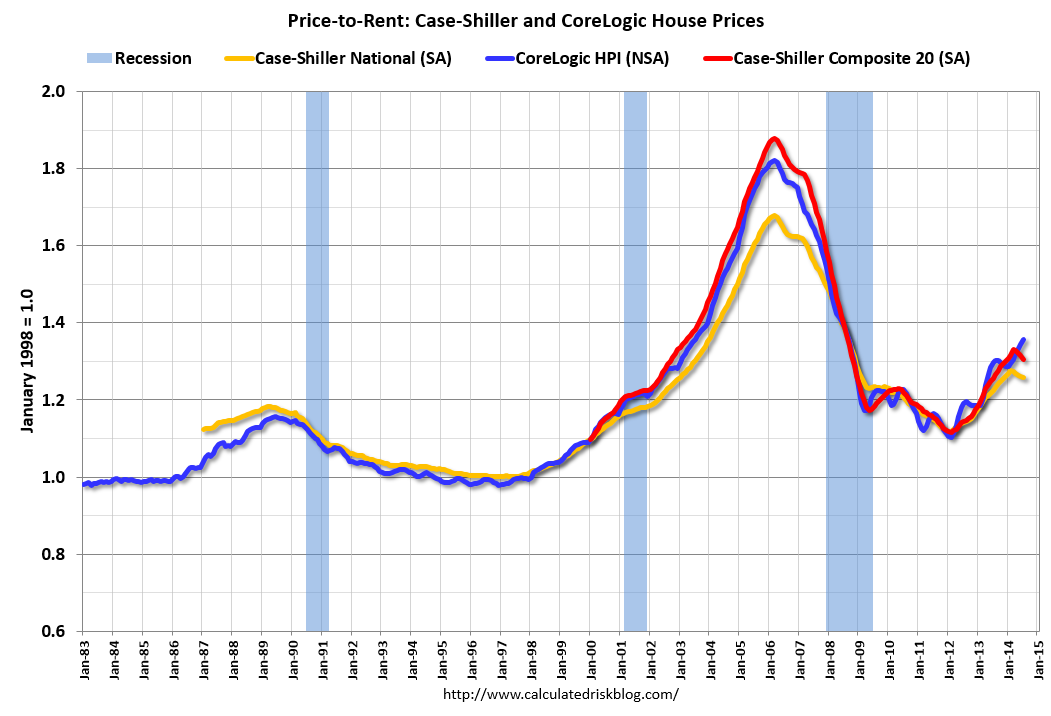 Here is a similar graph using the Case-Shiller National, Composite 20 and CoreLogic House Price Indexes.
This graph shows the price to rent ratio (January 1998 = 1.0).
On a price-to-rent basis, the Case-Shiller National index is back to December 2002 levels, the Composite 20 index is back to September 2002 levels, and the CoreLogic index is back to July 2003.
In real terms, and as a price-to-rent ratio, prices are mostly back to early 2000 levels.


