by Calculated Risk on 9/01/2014 11:00:00 AM
Monday, September 01, 2014
State and Local Governments: Contributions to GDP and Employment
Two and half years ago I argued that "most of the drag from state and local governments would be over by mid-year 2012. Just eliminating the drag from state and local governments would help GDP and employment growth". This has been an important change.
Here is a graph showing the contribution to percent change in GDP for residential investment and state and local governments since 2005.

The blue bars are for residential investment (RI), and RI was a significant drag on GDP for several years. RI (blue) added to GDP growth for a few years, before subtracting in Q4 2013 and Q1 2014. RI bounced back in Q2, and since RI is still very low, I expect RI to make a positive contribution to GDP for some time.
State and local governments had been a drag on GDP for several years (red). Although not as large a negative as the worst of the housing bust (and much smaller spillover effects), this decline was relentless and unprecedented.
Now the contribution from state and local governments has been positive for 5 of the last 6 quarters.
 The second graph shows total state and government payroll employment since January 2007. State and local governments lost jobs for four straight years, but the decline slowed sharply in 2012. (Note: Scale doesn't start at zero to better show the change.)
In July 2014, state and local governments added 11,000 jobs. State and local government employment is now up 151,000 from the bottom, but still 593,000 below the peak.
It is pretty clear that state and local employment is now increasing. Note: Federal government layoffs have slowed (unchanged in July), but Federal employment is still down 22,000 for the year.
I expect state and local governments to make a positive contribution going forward.
Sunday, August 31, 2014
Mortgage Rates: A Long Way to Fall for a Significant Increase in Refinance Activity
by Calculated Risk on 8/31/2014 09:26:00 PM
I've seen some recent discussion suggesting that mortgage refinance activity might pickup significantly if mortgage rates fall just a little more. I think this is incorrect.
First, from Freddie Mac last week: Mortgage Rates Remain Low Heading Into Holiday Weekend
Freddie Mac ... released the results of its Primary Mortgage Market Survey® (PMMS®), showing average fixed mortgage rates largely unchanged amid mixed news on the housing front heading into the Labor Day weekend.
...
30-year fixed-rate mortgage (FRM) averaged 4.10 percent with an average 0.5 point for the week ending August 28, 2014, unchanged from last week. A year ago at this time, the 30-year FRM averaged 4.51 percent.
15-year FRM this week averaged 3.25 percent with an average 0.6 point, up from last week when it averaged 3.23 percent. A year ago at this time, the 15-year FRM averaged 3.54 percent.
 Click on graph for larger image.
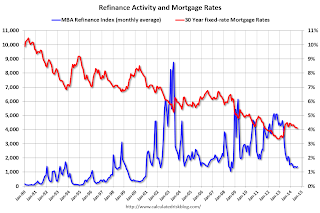
This graph shows the 30 year fixed rate mortgage interest rate from the Freddie Mac Primary Mortgage Market Survey® compared to the MBA refinance index.
The refinance index dropped sharply last year when mortgage rates increased. Historically refinance activity picks up significantly when mortgage rates fall about 50 bps from a recent level.
Sure, borrowers who took out mortgages last year can probably refinance now - but that is a small number of total borrowers. For a significant increase in refinance activity, rates would have to fall below the late 2012 lows (on a monthly basis, 30 year mortgage rates were at 3.35% in the PMMS in November and December 2012.
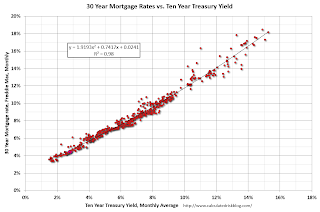
The second graph shows the relationship between the monthly 10 year Treasury Yield and 30 year mortgage rates from the Freddie Mac survey.
 Currently the 10 year Treasury yield is at 2.34% and 30 year mortgage rates are at 4.10% (according to the Freddie Mac survey). Based on the relationship from the graph, the 30 year mortgage rate (Freddie Mac survey) would be around 3.5% when 10-year Treasury yields are around 1.4% (unlikely any time soon).
To really have a refinance boom, 10-year Treasury yields would have to fall to 1% or so!
So I don't expect a significant increase in refinance activity any time soon.
Restaurant Performance Index declined in July
by Calculated Risk on 8/31/2014 12:49:00 PM
From the National Restaurant Association: Restaurant Performance Index Dipped in July
Due in part to a dampened outlook among restaurant operators, the National Restaurant Association’s Restaurant Performance Index (RPI) registered a modest decline in July. The RPI – a monthly composite index that tracks the health of and outlook for the U.S. restaurant industry – stood at 101.0 in July, down from a level of 101.3 in June and the second consecutive monthly decline. Despite the recent downticks, the RPI remained above 100 for the 17th consecutive month, which signifies expansion in the index of key industry indicators.
“Although restaurant operators reported positive same-store sales and customer traffic results in July, the RPI edged down as a result of a mixed outlook for the months ahead,” said Hudson Riehle, senior vice president of the Research and Knowledge Group for the Association. “Restaurant operators were less bullish about the direction of the overall economy, and rising wholesale food costs are once again starting to pose a significant challenge.”
emphasis added
 Click on graph for larger image.
The index decreased to 101.0 in July, down from 101.3 in June. (above 100 indicates expansion).
Restaurant spending is discretionary, so even though this is "D-list" data, I like to check it every month. Even with the recent declines in the index, this is still a decent level.
Saturday, August 30, 2014
Schedule for Week of August 31st
by Calculated Risk on 8/30/2014 01:11:00 PM
This will be a busy week for economic data. The key report is the August employment report on Friday.
Other key reports include the ISM manufacturing index on Tuesday and August vehicle sales on Wednesday.
The ECB rate decision and press conference with ECB President Mario Draghi on Thursday will be closely watched.
All US markets will be closed in observance of the Labor Day holiday.
Early: Black Knight Mortgage Monitor report for July.
 10:00 AM: ISM Manufacturing Index for August. The consensus is for a decrease to 56.8 from 57.1 in July.
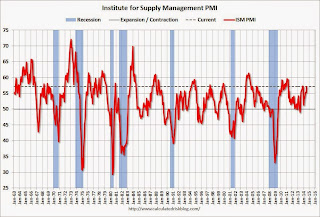
Here is a long term graph of the ISM manufacturing index.
The ISM manufacturing index indicated expansion in July at 57.1%. The employment index was at 58.2%, and the new orders index was at 63.4%.
10:00 AM: Construction Spending for July. The consensus is for a 0.8% increase in construction spending.
7:00 AM: The Mortgage Bankers Association (MBA) will release the results for the mortgage purchase applications index.
 All day: Light vehicle sales for August. The consensus is for light vehicle sales to increase to 16.5 million SAAR in August from 16.4 million in July (Seasonally Adjusted Annual Rate).
This graph shows light vehicle sales since the BEA started keeping data in 1967. The dashed line is the June sales rate.
10:00 AM: Manufacturers' Shipments, Inventories and Orders (Factory Orders) for July. The consensus is for a 10.5% increase in July orders.
2:00 PM: Federal Reserve Beige Book, an informal review by the Federal Reserve Banks of current economic conditions in their Districts.
1:45 PM CET (7:45 AM ET): Press conference following the Governing Council meeting of the ECB in Frankfurt with Mario Draghi. Here is the ECB website and press conference page.
8:15 AM: The ADP Employment Report for August. This report is for private payrolls only (no government). The consensus is for 213,000 payroll jobs added in August, down from 218,000 in July.
8:30 AM: The initial weekly unemployment claims report will be released. The consensus is for claims to increase to 305 thousand from 298 thousand.
 8:30 AM: Trade Balance report for July from the Census Bureau.
 Imports decreased and exports increased in June.
The consensus is for the U.S. trade deficit to be at $42.7 billion in July from $41.5 billion in June.
10:00 AM: ISM non-Manufacturing Index for August. The consensus is for a reading of 57.1, down from 58.7 in July. Note: Above 50 indicates expansion.
8:30 AM: Employment Report for August. The consensus is for an increase of 210,000 non-farm payroll jobs added in August, up slightly from the 209,000 non-farm payroll jobs added in July.
The consensus is for the unemployment rate to decrease to 6.1% in August.
 This graph shows the year-over-year change in total non-farm employment since 1968.
In July, the year-over-year change was 2.570 million jobs, and it generally appears the pace of hiring is increasing.
Right now it looks possible that 2014 will be the best year since 1999 for both total nonfarm and private sector employment growth.
As always, a key will be the change in real wages - and as the unemployment rate falls, wage growth should eventually start to pickup.
Unofficial Problem Bank list declines to 439 Institutions
by Calculated Risk on 8/30/2014 08:33:00 AM
This is an unofficial list of Problem Banks compiled only from public sources.
Here is the unofficial problem bank list for Aug 29, 2014.
Changes and comments from surferdude808:
As expected, the FDIC released q2 industry results and provided an update on its latest enforcement action activity. The update led to six removals from the Unofficial Problem Bank List pushing the list total down to 439 institutions with assets of $139.97 billion. A year ago, the list held 707 institutions with assets of $250.6 billion.CR Note: The FDIC's official problem bank list is comprised of banks with a CAMELS rating of 4 or 5, and the list is not made public. (CAMELS is the FDIC rating system, and stands for Capital adequacy, Asset quality, Management, Earnings, Liquidity and Sensitivity to market risk. The scale is from 1 to 5, with 1 being the strongest.)
Actions were terminated against First State Bank, Lonoke, AR ($256 million); The Business Bank, Appleton, WI ($253 million); First Financial Bank, Bessemer, AL ($183 million); Citizens State Bank, Hudson, WI ($146 million); South Georgia Bank, Glennville, GA ($125 million); and Golden State Bank, Upland, CA ($92 million Ticker: GSBB).
The FDIC told there are 354 institutions with assets of $110 billion on the Official Problem Bank List. Since their last update, the official list declined by 13.9 percent or 57 institutions, which the largest percentage decline over the past 13 quarters since the official list peaked at 888 institutions in the first quarter of 2011. The unofficial list fell by an identical 57 institutions since the last update from the FDIC on May 28, 2014.
As a substitute for the CAMELS ratings, surferdude808 is using publicly announced formal enforcement actions, and also media reports and company announcements that suggest to us an enforcement action is likely, to compile a list of possible problem banks in the public interest.
When the list was increasing, the official and "unofficial" counts were about the same. Now with the number of problem banks declining, the unofficial list is lagging the official list. This probably means regulators are changing the CAMELS rating on some banks before terminating the formal enforcement actions.


