by Calculated Risk on 12/02/2012 03:12:00 PM
Sunday, December 02, 2012
Report: Germany to eventually consider Greek Losses
From the Financial Times: Merkel prepared to consider Greek losses
"If Greece one day handles its revenues again without taking on new debt, then we must take a look at the situation and assess it,” the [Chancellor Angela Merkel] told Germany’s Bild am Sonntag newspaper ... even Wolfgang Schäuble, Germany’s finance minister, last week hinted [a haircut on official debt] could come eventually.Eventually some of the official debt will have to be forgiven. This will not happen until after the German election next September, and probably not until 2014 at the earliest.
excerpt with permission
Note: Long term readers probably remember the "Lord of the Dark Matter" who provided excellent insights on the derivative market. We discussed Europe about a week ago, and his view was a "short of full blown restructuring, there is no solution". Maybe - just maybe - the Germans are starting to realize that there will have to an official restructuring for Greece - and that would be a positive step.
Impact of Sandy on Employment, November Contest Winners
by Calculated Risk on 12/02/2012 09:19:00 AM
A key question for the November employment report, to be released Friday, is the impact of Hurricane Sandy. Sandy hit New York city on October 29th.
Hurricane Katrina hit New Orleans on August 29, 2005, so it might be helpful to look back at the impact on employment in the months following Katrina for some clues. Here is the BLS report for September 2005 with a note on Katrina (I expect a note in the November report related to Sandy). Katrina was a much larger storm, and large areas were devastated, but Sandy struck an area with a much larger population - so the impact on employment might be similar.
The following table shows the average number of jobs added for the four months prior to the storm (both storms hit at the end of a month - after the BLS reference period). Following Katrina, employment gains dropped sharply for the next two months. Note: September 2005 (the first month following Katrina) was originally reported at -35,000, but was eventually revised up to +66,000.
| Total Nonfarm Jobs, 1 Month Net Change (000) | ||
|---|---|---|
| Katrina | Sandy | |
| Average (4 previous months) | 245 | 173 |
| Month After Storm | 66 | |
| 2nd Month After | 80 | |
| Average 3rd and 4th Month | 247 | |
The consensus is for an increase of 80,000 non-farm payroll jobs in November 2012.
Here are the winners for the November economic question contest:
1st: Terry Oldham
2nd: Pat MacAuley
3rd tie: Alexander Petrov, Daniel Brawdy
Congratulations all!
Yesterday:
• Summary for Week Ending Nov 30th
• Schedule for Week of Dec 2nd
Saturday, December 01, 2012
House Prices: Case-Shiller to turn negative month-to-month seasonally in October
by Calculated Risk on 12/01/2012 07:29:00 PM
I expect the Case-Shiller Composite 20 Not Seasonally Adjusted (NSA) index to decline month-to-month in October. This will not be a sign of impending doom - or another collapse in house prices - it is just the normal seasonal pattern. I expect smaller month-to-month declines this winter than for the same months last year.
Even in normal times house prices tend to be stronger in the spring and early summer, than in the fall and winter. Currently there is a stronger than normal seasonal pattern because conventional sales are following the normal pattern (more sales in the spring and summer), but distressed sales (foreclosures and short sales) happen all year. So distressed sales have a larger negative impact on prices in the fall and winter.
In the coming months, the key will be to watch the year-over-year change in house prices and to compare to the NSA lows in early 2012. I think the house price indexes have already bottomed, and will be up about 5% year-over-year when prices reach the usual seasonal bottom in early 2013.
 Click on graph for larger image.
This graph shows the month-to-month change in the CoreLogic and NSA Case-Shiller Composite 20 index over the last several years (both through September). The CoreLogic index turned negative month-to-month in the September report (CoreLogic is a 3 month weighted average, with the most recent month weighted the most). Case-Shiller NSA will probably turn negative month-to-month in the October report (also a three month average, but not weighted).
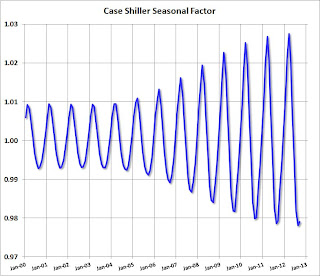
 The second graph shows the seasonal factors for the Case-Shiller composite 20 index. The factors started to change near the peak of the bubble, and really increased during the bust.
Note: I was one of several people to question this change in the seasonal factor - and this led to S&P Case-Shiller reporting the NSA numbers.
It appears the seasonal factor has stopped increasing, and I expect that over the next several years - as the percent of distressed sales decline - the seasonal factors will slowly move back towards the previous levels.
Summary for Week Ending Nov 30th
by Calculated Risk on 12/01/2012 11:59:00 AM
Overall the economic data was weaker than expected last week, even the housing data. New home sales were at a seasonally adjusted annual rate (SAAR) of 368 thousand in October, below expectations of 387,000. However sales are still up close to 20% from 2011.
Hurricane Sandy continues to negatively impact the economic numbers. Personal income and outlays for October were especially weak, and weekly initial unemployment claims remained elevated.
And, once again, the regional manufacturing surveys indicated contraction (except Richmond).
Overall this was a disappointing week, but it is difficult to separate out the underlying trend from the impact of Hurricane Sandy.
Of course most of the headlines last week were about the so-called "fiscal cliff". Some news agencies are running embarrassing countdown timers, even though there is no drop dead date. I still think a deal in early January is likely, although I'd like to see an agreement reached sooner.
Here is a summary of last week in graphs:
• New Home Sales at 368,000 SAAR in October
 The Census Bureau reports New Home Sales in October were at a seasonally adjusted annual rate (SAAR) of 368 thousand. This was down from a revised 369 thousand SAAR in August (revised down from 389 thousand).
The first graph shows New Home Sales vs. recessions since 1963. The dashed line is the current sales rate.
On inventory, according to the Census Bureau:
"A house is considered for sale when a permit to build has been issued in permit-issuing places or work has begun on the footings or foundation in nonpermit areas and a sales contract has not been signed nor a deposit accepted."
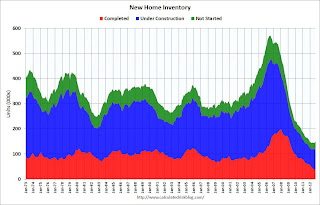
 Starting in 1973 the Census Bureau broke this down into three categories: Not Started, Under Construction, and Completed.
This graph shows the three categories of inventory starting in 1973.
The inventory of completed homes for sale was just above the record low in October. The combined total of completed and under construction is also just above the record low since "under construction" is starting to increase.
The last graph shows sales NSA (monthly sales, not seasonally adjusted annual rate).
 In October 2012 (red column), 29 thousand new homes were sold (NSA). Last year only 25 thousand homes were sold in October. This was the third weakest October since this data has been tracked (above 2011 and 2010). The high for October was 105 thousand in 2005.
New home sales have averaged 361 thousand SAAR over the first 10 months of 2012, up sharply from the 307 thousand sales in 2011. Also sales are finally at the lows for previous recessions too.
This was below expectations of 387,000.
• Case-Shiller: Comp 20 House Prices increased 3.0% year-over-year in September
 From S&P: Home Prices Rise for the Sixth Straight Month According to the S&P/Case-Shiller Home Price Indices
Note: These graphs use the Seasonally Adjusted (SA) data.
The first graph shows the nominal seasonally adjusted Composite 10 and Composite 20 indices (the Composite 20 was started in January 2000).
The Composite 10 index is off 31.4% from the peak, and up 0.3% in September (SA). The Composite 10 is up 4.2% from the post bubble low set in January 2012 (SA).
 The Composite 20 index is off 30.7% from the peak, and up 0.4% (SA) in September. The Composite 20 is up 4.7% from the post-bubble low set in January 2012 (SA).
The second graph shows the Year over year change in both indices.
The Composite 10 SA is up 2.1% compared to September 2011.
The Composite 20 SA is up 3.0% compared to September 2011. This was the fourth consecutive month with a year-over-year gain since 2010 (when the tax credit boosted prices temporarily).
 The third graph shows the price declines from the peak for each city included in S&P/Case-Shiller indices.
Prices increased (SA) in 19 of the 20 Case-Shiller cities in September seasonally adjusted (15 of 20 cities increased NSA). Prices in Las Vegas are off 59.1% from the peak, and prices in Dallas only off 4.8% from the peak. Note that the red column (cumulative decline through September 2012) is above previous declines for all cities.
• Real House Prices, Price-to-Rent Ratio
Case-Shiller, CoreLogic and others report nominal house prices, and it is also useful to look at house prices in real terms (adjusted for inflation) and as a price-to-rent ratio.
 This graph shows the quarterly Case-Shiller National Index SA (through Q3 2012), and the monthly Case-Shiller Composite 20 SA and CoreLogic House Price Indexes (through September) in real terms (adjusted for inflation using CPI less Shelter). Note: some people use other inflation measures to adjust for real prices.
In real terms, the National index is back to mid-1999 levels, the Composite 20 index is back to June 2000, and the CoreLogic index back to February 2001.
In real terms, most of the appreciation in the last decade is gone.
In October 2004, Fed economist John Krainer and researcher Chishen Wei wrote a Fed letter on price to rent ratios: House Prices and Fundamental Value. Kainer and Wei presented a price-to-rent ratio using the OFHEO house price index and the Owners' Equivalent Rent (OER) from the BLS.
 Here is a similar graph using the Case-Shiller National, Composite 20 and CoreLogic House Price Indexes.
This graph shows the price to rent ratio (January 1998 = 1.0).
On a price-to-rent basis, the Case-Shiller National index is back to Q3 1999 levels, the Composite 20 index is back to July 2000 levels, and the CoreLogic index is back to February 2001.
In real terms - and as a price-to-rent ratio - prices are mostly back to 1999 or early 2000 levels.
• Personal Income unchanged in October, Spending decreased 0.2%
 The BEA released the Personal Income and Outlays report for October:
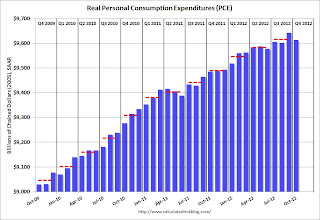
 Personal income increased $0.4 billion, or less than 0.1 percent ... in October, according to the Bureau of Economic Analysis. Personal consumption expenditures (PCE) decreased $20.2 billion, or 0.2 percent.This graph shows real PCE by month for the last few years. The dashed red lines are the quarterly levels for real PCE. According to the BEA, Hurricane Sandy impacted PCE in October, but the BEA could not quantify the total impact - however PCE in October was weak.
A key point is the PCE price index has only increased 1.7% over the last year, and core PCE is up only 1.6%.
• Weekly Initial Unemployment Claims decline to 393,000
 The dashed line on the graph is the current 4-week average. The four-week average of weekly unemployment claims increased to 405,250.
This sharp increase in the 4 week average is due to Hurricane Sandy as claims increased significantly in the impacted areas (update: claims increased in NY, NJ and other impacted areas over the 4-week period - some of those areas saw a decline this week). Note the spike in 2005 related to hurricane Katrina - we are seeing a similar impact, although on a smaller scale.
• Regional Manufacturing Surveys mostly weak in November
Most of the regional manufacturing surveys were weak in November (Richmond was the exception). From the Kansas City Fed: Tenth District Manufacturing Activity Eased Further
The month-over-month composite index was -6 in November, down from -4 in October and 2 in September.From the Dallas Fed: Texas Manufacturing Activity: Growth Stalls and Company Outlook Worsens
The general business activity index fell to -2.8, returning to negative territory. The company outlook index moved down to -4.8, registering its first negative reading since April.From the Richmond Fed: Manufacturing Activity Advanced in November; Optimism Increased
In November, the seasonally adjusted composite index of manufacturing activity — our broadest measure of manufacturing — gained sixteen points to 9 from October's reading of −7.
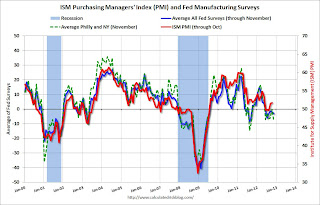
 Here is a graph comparing the regional Fed surveys and the ISM manufacturing index:
The New York and Philly Fed surveys are averaged together (dashed green, through November), and five Fed surveys are averaged (blue, through November) including New York, Philly, Richmond, Dallas and Kansas City. The Institute for Supply Management (ISM) PMI (red) is through October (right axis).
The ISM index for November will be released Monday, Dec 3rd, and these surveys suggest another weak reading.
Schedule for Week of Dec 2nd
by Calculated Risk on 12/01/2012 08:20:00 AM
Note: I'll post a summary for last week later today.
The key report next week is the November employment report to be released on Friday. Other key reports include November auto sales on Monday, the November ISM manufacturing index, and the November ISM service index.
The November employment report will probably be negatively impacted by Hurricane Sandy, but November auto sales probably saw a boost from the storm.
The Q3 Flow of Funds report will be released on Thursday.
The FDIC is expected to release the Q3 Quarterly Banking Profile this week.
 10:00 AM ET: ISM Manufacturing Index for November.
 Here is a long term graph of the ISM manufacturing index. The ISM manufacturing index indicated expansion in October. The PMI was at 51.7%, up from 51.5% in September. The employment index was at 52.1%, down from 54.7%, and the new orders index was at 54.2%, up from 52.3%. The consensus is for be PMI to be unchanged at 51.7. (above 50 is expansion).
10:00 AM: Construction Spending for October. The consensus is for a 0.4% increase in construction spending.
All day: Light vehicle sales for November. The consensus is for light vehicle sales to increase to 15.0 million SAAR in November (Seasonally Adjusted Annual Rate) from 14.2 million in October (October sales were impacted by Hurricane Sandy).
 This graph shows light vehicle sales since the BEA started keeping data in 1967. The dashed line is the October sales rate.
 TrueCar is forecasting:
The November 2012 forecast translates into a Seasonally Adjusted Annualized Rate (“SAAR”) of 15.2 million new car sales, up from 13.5 million in November 2011 and up from 14.3 million in October 2012
10:00 AM: Trulia Price Rent Monitors for November. This is the index from Trulia that uses asking prices adjusted both for the mix of homes listed for sale and for seasonal factors.
7:00 AM: The Mortgage Bankers Association (MBA) will release the mortgage purchase applications index.
8:15 AM: The ADP Employment Report for November. This report is for private payrolls only (no government). The consensus is for 125,000 payroll jobs added in November. This is the second report using the new methodology, and the report last month (158,000) was fairly close to the BLS report for private employment (the BLS reported 184,000 private sector jobs added in November).
10:00 AM: Manufacturers' Shipments, Inventories and Orders (Factory Orders) for October. The consensus is for a 0.1% decrease in orders.
10:00 AM: ISM non-Manufacturing Index for November. The consensus is for a decrease to 53.6 from 54.2 in October. Note: Above 50 indicates expansion, below 50 contraction.
8:30 AM: The initial weekly unemployment claims report will be released. The consensus is for claims to decrease to 380 thousand from 393 thousand.
12:00 PM: Q3 Flow of Funds Accounts of the United States from the Federal Reserve.
 8:30 AM: Employment Report for November. The consensus is for an increase of 80,000 non-farm payroll jobs in November; there were 171,000 jobs added in October. The October reference period was before Hurricane Sandy, and the impact from Sandy will show up in the November report.
The consensus is for the unemployment rate to increase to 8.0% in November, up from 7.9% in October.
This second employment graph shows the percentage of payroll jobs lost during post WWII recessions through September.
 The economy has added 5.4 million private sector jobs since employment bottomed in February 2010 including preliminary benchmark revision (4.9 million total jobs added including all the public sector layoffs).
There are still 3.45 million fewer private sector jobs now than when the recession started in 2007 (including benchmark revision).
9:55 AM: Reuter's/University of Michigan's Consumer sentiment index (preliminary for December). The consensus is for sentiment to increase slightly to 83.0.
3:00 PM: Consumer Credit for October. The consensus is for credit to increase $10.0 billion.


