 RSS Feed
 by Calculated Risk on 6/27/2010 08:13:00 PM
Showing posts with label vacancies. Show all posts
Showing posts with label vacancies. Show all posts
Sunday, June 27, 2010
Housing Supply Metrics
Here is a table of various housing supply measures (just putting this in one place with links to the source data).
Note: here is the Weekly Summary and a Look Ahead. It will be a busy week!
| Total delinquent loans1 | 7.3 million |
| Seriously delinquent loans1,2 | 5.0 million |
| Total REO Inventory3 | 0.5 million |
| Fannie, Freddie, FHA REO4 | 210 thousand |
| Homeowners with Negative Equity5 | 11.2 million |
| Homeowner vacancy rate6 | 2.6% |
| Rental vacancy rate6 | 10.6% |
| Excess Vacant Units6,7 | 1.7 million |
| Existing Home Inventory8 | 3.89 million |
| Existing Home Months of Supply8 | 8.3 months |
| New Home Inventory9 | 213 thousand |
| New Home Months of Supply9 | 8.5 months |
1 Source: estimate based on the Mortgage Bankers Association’s (MBA) Q1 2010 National Delinquency Survey. "MBA’s National Delinquency Survey covers about 44.4 million first lien mortgages on one-to four-unit residential properties ... The NDS is estimated to cover around 85 percent of the outstanding first-lien mortgages in the country."
2 This is based on the MBA's estimate of loans 90+ days delinquent or in the foreclosure process.
3 Source: Radarlogic and Barclays as of Feb 2010.
4 Source: Fannie Mae, Freddie Mac and FHA. Fannie, Freddie, FHA REO Inventory Surges 22% in Q1 2010
5 Source: CoreLogic Q1 2010 Negative Equity Report
6 Source: Census Bureau Residential Vacancies and Homeownership in the First Quarter 2010
7 CR calculation.
8 Source: National Association of Realtors
9 Source: Census Bureau New Residential sales
Monday, April 26, 2010
Q1 2010: Homeownership Rate Lowest Since Q1 2000
by Calculated Risk on 4/26/2010 10:00:00 AM
The Census Bureau reported the homeownership and vacancy rates for Q1 2010 this morning. Here are a few graphs ...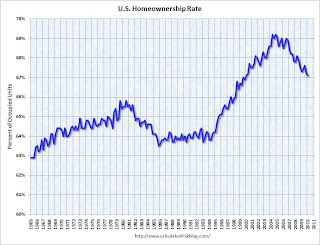 Click on graph for larger image in new window.
The homeownership rate declined to 67.1%. This is the lowest level since Q1 2000.
Note: graph starts at 60% to better show the change.
The homeownership rate increased in the '90s and early '00s because of changes in demographics and "innovations" in mortgage lending. The increase due to demographics (older population) will probably stick, so I've been expecting the rate to decline to the 66% to 67% range - and not all the way back to 64% to 65%.  The homeowner vacancy rate was 2.6% in Q1 2010.
A normal rate for recent years appears to be about 1.7%.
This leaves the homeowner vacancy rate about 0.9% above normal. This data is not perfect, but based on the approximately 75 million homeowner occupied homes, we can estimate that there are close to 675 thousand excess vacant homes.
The rental vacancy rate was 10.6% in Q1 2010.  It's hard to define a "normal" rental vacancy rate based on the historical series, but we can probably expect the rate to trend back towards 8%. According to the Census Bureau there are close to 41 million rental units in the U.S. If the rental vacancy rate declined from 10.6% to 8%, there would be 2.6% X 41 million units or over 1 million units absorbed.
This suggests there are still about 1.7 million excess housing units, and these excess units will keep pressure on housing starts, rents and house prices for some time.
Wednesday, February 17, 2010
Housing Starts, Vacant Units and the Unemployment Rate
by Calculated Risk on 2/17/2010 12:29:00 PM
The following two graphs are updates from previous posts with the housing start data released this morning.
The following graph shows total housing starts and the percent vacant housing units (owner and rental) in the U.S. Note: this is a combined vacancy rate based on the Census Bureau vacancy rates for owner occupied and rental housing through Q4 2009. Click on graph for larger image in new window.
Notice that total starts are not rebounding quickly as a number of analysts expected. Instead starts have moved sideways for the last eight months.
It is very unlikely that there will be a strong rebound in housing starts with a near record number of vacant housing units.
The vacancy rate has continued to climb even after housing starts fell off a cliff. Initially this was because of a significant number of completions. Also some hidden inventory (like some 2nd homes) have become available for sale or for rent, and lately some households have probably doubled up because of tough economic times. The second graph shows single family housing starts and unemployment (inverted). (The first graph shows total housing starts)
You can see both the correlation and the lag. The lag is usually about 12 to 18 months, with peak correlation at a lag of 16 months for single unit starts. The 2001 recession was a business investment led recession, and the pattern didn't hold.
This suggests unemployment might peak in Summer 2010 since housing starts bottomed in April 2009. However, since I expect the housing recovery to be sluggish, I also expect unemployment to remain high throughout 2010.
Sunday, November 15, 2009
Housing Starts and Vacant Units: No "V" Shaped Recovery
by Calculated Risk on 11/15/2009 07:31:00 PM
On Friday I posted a graph showing the historical relationship between housing starts and the unemployment rate (repeated as the 2nd graph below). The graph shows that housing leads the economy both into and out of recessions, and the unemployment rate lags housing by about 12 to 18 months.
It appears that housing starts bottomed earlier this year, however I don't think we will see a sharp recovery in housing this time - and I also think unemployment will remain high throughout 2010. As I noted in the earlier post, there is still a large overhang of vacant housing in the United States, and a sharp bounce back in housing starts is unlikely.
The following graph shows total housing starts and the percent vacant housing units (owner and rental) in the U.S. Note: this is a combined vacancy rate based on the Census Bureau vacancy rates for owner occupied and rental housing. Click on graph for larger image in new window.
It is very unlikely that there will be a strong rebound in housing starts with a record number of vacant housing units.
The vacancy rate has continued to climb even after housing starts fell off a cliff. Initially this was because of a significant number of completions. Also some hidden inventory (like some 2nd homes) have become available for sale or for rent, and lately some households have probably doubled up because of tough economic times.
Note: the increase in the vacancy rate in the '80s was due to several factors including demographics (baby boomers moving from renting to owning), and overbuilding of apartment units (part of S&L crisis).
Here is a repeat of the earlier graph: This graph shows single family housing starts and unemployment (inverted). (The first graph shows total housing starts)
You can see both the correlation and the lag. The lag is usually about 12 to 18 months, with peak correlation at a lag of 16 months for single unit starts. The 2001 recession was a business investment led recession, and the pattern didn't hold.
This suggests unemployment might peak in Spring or Summer 2010. However, since I expect the housing recovery to be sluggish, I also expect unemployment to remain high throughout 2010.
Saturday, April 26, 2008
Vandos and Bandos
by Calculated Risk on 4/26/2008 08:18:00 PM
Bandos - squatters in abandoned homes.
Vandos - vandals that damage abandoned homes.
This is becoming a frequent story - from the WaPo: Foreclosed Homes Attract Vandalism
The growing foreclosure crisis has forced suburban law enforcement agencies to tackle a new challenge: policing empty houses.And here is the source of "bandos", from the AP: Some homeless turn to foreclosed homes
As evictions mount and many houses remain unsold for months, even years, vacant properties have become havens for squatters, vandals, thieves, partying teenagers and worse, officials said.
Bandos is a funny name, but abandoned homes are a real pain for the neighbors; a classic negative externality.
Monday, March 31, 2008
Good Riddance
by Anonymous on 3/31/2008 11:51:00 AM
UPDATE: I don't have time to spend the day deleting racist trolling. I have therefore closed the comments on this thread. We simply are not here to host such things.
Alphonso Jackson resigned as Secretary of HUD today. And not a moment too soon. Think Progress has the list:
A look at Jackson’s tenure of incompetence and corruption:Let's hope someone gets this taken down before the end of the day.
Loyalty Over Merits: During a speech on April 28, 2006, Jackson recounted a conversation he had with a prospective contractor who had a “heck of a proposal.” This contractor, however, told Jackson, “I don’t like President Bush.” Jackson subsequently refused to award the man the contract. A former HUD assistant secretary confirmed that Jackson told agency employees to “consider presidential supporters when you are considering the selected candidates for discretionary contracts.”
Political Retaliation: In 2006, Jackson allegedly demanded that the Philadelphia Housing Authority (PHA) “transfer a $2 million public property” at a “substantial discount” to Kenny Gamble, a developer, former soul-music songwriter, and friend of Jackson’s. When PHA director Carl Greene refused, Jackson and his aides called Philadelphia’s mayor and “followed up with ‘menacing’ threats about the property and other housing programs in at least a dozen letters and phone calls over an 11-month period.”
Contracts For Golfing Buddies: In October 2007, federal investigators looked into whether, after Hurricane Katrina, Jackson lined up an emergency “no-bid contract” at the HUD-controlled Housing Authority of New Orleans for “golfing buddy” and friend William Hairston. According to HUD, the emergency contract paid Hairston $392,000 over a year and a half; Hairston’s partner companies also received “direct contracts” with HUD. One of the companies which received a contract in New Orleans, Columbia Residential, had “significant financial ties to Jackson.” Jackson’s wife also had “ties to two companies that did business with the New Orleans authority.”
Awarding Corrupt Companies: Shirlington Limousine and Transportation Inc. is the firm that defense contractor Brent Wilkes used to “transport congressmen, CIA officials, and perhaps prostitutes to his Washington parties.” The firm’s president had a “lengthy history of illegal activity,” detailed in his 62-page rap-sheet, and his limo company “operates in what looks to be a deliberately murky way.” Despite all this, Jackson’s HUD awarded Shirlington a contract worth $519,823.
Lucrative Salaries For Cronies: Atlanta lawyer Michael Hollis, another Jackson friend, “appears to have been paid approximately $1 million for managing the troubled Virgin Islands Housing Authority,” despite having “no experience in running a public housing agency.” A “top Jackson aide” reportedly made it clear to officials within HUD that “Jackson wanted Hollis” for the job. Hollis received more than four times the salary of his predecessor.
Friday, October 26, 2007
Census Bureau: Vacancy Rates Stable in Q3
by Calculated Risk on 10/26/2007 01:57:00 PM
From the Census Bureau on Residential Vacancies and Homeownership
National vacancy rates in the third quarter 2007 were 9.8 percent for rental housing and 2.7 percent for homeowner housing, the Department of Commerce’s Census Bureau announced today. The Census Bureau said the rental vacancy rate was not statistically different from the third quarter rate last year, or the rate last quarter. For homeowner vacancies, the current rate was higher than a year ago (2.5 percent), but was not statistically different than the rate last quarter (2.6 percent). The homeownership rate at 68.2 percent for the current quarter was lower than the third quarter 2006 rate, but was not statistically different from the rate last quarter.
 Click on graph for larger image.
The first graph shows the homeowner vacancy rate since 1956. A normal rate for recent years appears to be about 1.7%. There is some noise in the series, quarter to quarter, but it does appear the vacancy rate has stabilized.
This leaves the homeowner vacancy rate almost 1% above normal, or about 750 thousand excess homes.
 The rental vacancy rate has been trending down slightly for almost 3 years (with some noise). This was due to a decline in the total number of rental units in 2004, and more recently due to more households choosing renting over owning.
It's hard to define a "normal" rental vacancy rate based on the historical series, but we can probably expect the rate to trend back towards 8%. This would suggest there are about 600 thousand excess rental units in the U.S. that need to be absorbed.
This suggests there are about 1.35 million excess housing units in the U.S. that need to be worked off over the next few years. These excess units will keep pressure on housing starts for some time.


