 RSS Feed
 by Calculated Risk on 4/20/2011 02:16:00 PM
Showing posts with label consumer credit. Show all posts
Showing posts with label consumer credit. Show all posts
Wednesday, April 20, 2011
Moody's: Commercial Real Estate Prices declined 3.3% in February
Moody's reported today that the Moody’s/REAL All Property Type Aggregate Index declined 3.3% in February. Note: Moody's CRE price index is a repeat sales index like Case-Shiller - but there are far fewer commercial sales and there are a large percentage of distressed sales - and that can impact prices and make the index very volatile.
Below is a comparison of the Moodys/REAL Commercial Property Price Index (CPPI) and the Case-Shiller composite 20 index. Beware of the "Real" in the title - this index is not inflation adjusted.
The Moody’s/REAL Commercial Property Price Index fell 3.3 percent from January and 4.9 percent from a year earlier. It’s up 0.8 percent from an eight-year low in August, Moody’s said in a statement today.
 Click on graph for larger image in graph gallery.
CRE prices only go back to December 2000. The Case-Shiller Composite 20 residential index is in blue (with Dec 2000 set to 1.0 to line up the indexes).
According to Moody's, CRE prices are down 4.9% from a year ago and down about 44.7% from the peak in 2007. Prices are just above the post-bubble low last August - and about at the levels of 2002.
Earlier:
• Existing Home Inventory decreases 2.1% Year over Year
• March Existing Home Sales: 5.10 million SAAR, 8.4 months of supply
Thursday, December 30, 2010
Hotels: RevPAR up 3.6% compared to same week in 2009
by Calculated Risk on 12/30/2010 08:18:00 PM
A weekly update on hotels from HotelNewsNow.com: STR: US performance for week ending 25 Dec.
In year-over-year comparisons, occupancy increased 2.2 percent to 34.6 percent, average daily rate was up 1.4 percent to US$87.13, and revenue per available room finished the week up 3.6 percent to US$30.16.The following graph shows the four week moving average for the occupancy rate by week for 2008, 2009 and 2010 (and a median for 2000 through 2007).
 Click on graph for larger image in graph gallery.
Notes: the scale doesn't start at zero to better show the change. The graph shows the 4-week average, not the weekly occupancy rate.
This is the slow season for hotels, and the key will be if business travel picks up early next year.
When 2010 started, hotel occupancy was running about the same rate as in 2009 - the worst year for hotels since the Great Depression. In the spring, the occupancy rate increased, and by mid-year occupancy had caught up with 2008 (2008 was weak year for hotels). For the last couple of months the occupancy rate has been running ahead of 2008. The year-over-year comparisons will look great in early 2011, but an important comparison will be with the median for '00 through '07.
A few comments from Jeff Higley at HotelNewsNow.com: There’s more than one way to describe 2010
I don’t fall in the camp that believes the United States hotel industry is in the midst of a full recovery just yet.Data Source: Smith Travel Research, Courtesy of HotelNewsNow.com
Sure, there are signs the worst is over as hoteliers across the country are trying to dig out from the economic mess of the past two years. 2010 has been a year of extremes for the industry. It seems every week sends a different signal regarding the industry’s trek to recovery.
...
One full-service property I stayed at had a 7% occupancy rate on one of the nights of my visit; another property had 12 cars in the parking lot during the overnight hours. ... One the other hand, more roomnights were sold during July than any other month EVER, according to STR data.
...
In a nutshell, the hotel industry is seeing positive signs, but there’s still a long way to go before it can say it is in a true recovery. There are plenty of ways to measure success, but in this business there’s only one that truly counts: rates. When we see at least four months of year-over-year increases in rate and when the overall average daily rate gets to within five bucks of its $107 peak in 2008 (it’s about $10 off right now), it will be time to truly break out the recovery bubbly.
Thursday, July 08, 2010
Consumer Credit declines sharply in May
by Calculated Risk on 7/08/2010 06:51:00 PM
The Federal Reserve reports:
Consumer credit decreased at an annual rate of 4-1/2 percent in May 2010. Revolving credit decreased at an annual rate of 10-1/2 percent, and nonrevolving credit decreased at an annual rate of 1-1/2 percent.
 Click on graph for larger image in new window.
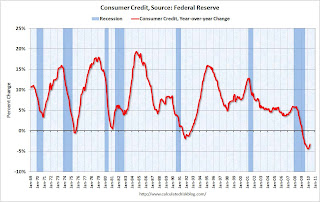
This graph shows the year-over-year (YoY) change in consumer credit. Consumer credit is off 3.9% over the last 12 months.
Revolving credit (credit card debt) is off 14.9% from the peak. Non-revolving debt (auto, furniture, and other loans) is off 1.5% from the peak. Note: Consumer credit does not include real estate debt.
Still working down the debt ... also the previously reported slight increase in April was revised to a $14.9 billion decrease in credit.
Wednesday, July 07, 2010
Reis: Apartment Vacancy Rates decline slightly
by Calculated Risk on 7/07/2010 11:59:00 PM
From Nick Timiraos at the WSJ: Apartment Vacancies Fell in Quarter
The national apartment vacancy rate stood at 7.8% at the end of June, according to Reis Inc., a New York real-estate research firm. That was down from the 8% vacancy rate during the first quarter, which was the highest vacancy rate in 30 years. ...This is still near the record vacancy rate set last quarter. This decline fits with the recent survey from the NMHC that showed lower apartment vacancies.
Rents gained by 0.7% during the seasonally strong April-to-June period, the biggest quarterly gain in two years.
Note: the Reis numbers are for cities. The overall vacancy rate from the Census Bureau was at a near record 10.6% in Q1 2010.
Monday, June 07, 2010
Consumer Credit increases slightly in April
by Calculated Risk on 6/07/2010 03:00:00 PM
The Federal Reserve reports:
Consumer credit increased at an annual rate of 1/2 percent in April 2010. Revolving credit decreased at an annual rate of 12 percent, and nonrevolving credit increased at an annual rate of 7 percent.
 Click on graph for larger image in new window.
This graph shows the year-over-year (YoY) change in consumer credit. Consumer credit is off 3.2% over the last 12 months.
Note: The Fed reports a simple annual rate (multiplies change in month by 12) as opposed to a compounded annual rate. Consumer credit does not include real estate debt.
Usually there is a fairly sharp increase in consumer credit during a robust recovery - but that isn't happening this time because household balance sheets are still a mess. Just another reminder that the recovery will be sluggish and choppy ...
Sunday, October 25, 2009
Capmark Files Bankruptcy
by Calculated Risk on 10/25/2009 07:39:00 PM
No surprise ...
Press Release: Capmark Financial Group Inc. Seeks To Restructure Balance Sheet Through Chapter 11 Reorganization Process
Capmark Financial Group Inc. ("Capmark") today announced that Capmark and certain of its subsidiaries have filed voluntary petitions for relief under Chapter 11 of the U.S. Bankruptcy Code in the U.S. Bankruptcy Court for the District of Delaware. Capmark intends to use the reorganization process to implement a restructuring that reduces its corporate debt and maximizes value for its stakeholders. Capmark`s businesses are continuing to operate in the ordinary course.More from Bloomberg: Lender Capmark Financial Group Files for Bankruptcy
Capmark Bank, which recently received $600 million of new equity from Capmark, is not part of the filing.
Wednesday, September 09, 2009
Corus Bank: "The Great Enabler of Condo Madness"
by Calculated Risk on 9/09/2009 09:12:00 PM
From Eric Dash at the NY Times: In Florida, Vestiges of the Boom
On the corner of Flamingo Road and Pink Flamingo Lane ... a soaring monument to the great condominium bust bakes under the Florida sun.This article touches on several key points - the speculative activities of Corus, the slow response of their primary regulator, the FDIC trying to split the bank in two to sell the banking operations (not worth much) separately from the "monuments to madness" condo towers (also not worth much), the coming losses from C&D and CRE loans for other banks, the coming hit from Corus to the Deposit Insurance Fund (DIF) and more ...
The Tao Sawgrass ... built on the western fringes of Fort Lauderdale with easy money from the now tottering condo king of American finance: Corus Bancshares of Chicago. Only about 50 of the 396 units have been sold.
... The primary regulator of Corus, the Office of the Comptroller of the Currency, failed to sound the alarm until Corus was deeply troubled. ... Corus will go down as the great enabler of condo madness, and its travails are a harbinger of the pain yet to come in the troubled world of commercial real estate.
...regulators are moving to cleave the bank in two and sell its banking operations and condominium loans separately. The hope is to clinch a deal by the end of the month.
Also, this article suggests Corus might have until the end of the month. However the bids for assets were due last Thursday, and I think it is likely that Corus will be seized this week.
Thursday, July 09, 2009
Treasury Working on 'Plan C'
by Calculated Risk on 7/09/2009 03:06:00 PM
From the WaPo: Treasury Works on 'Plan C' To Fend Off Lingering Threats
... the Treasury Department has assembled a team to examine what could yet bring it down and has identified several trouble spots ... Informally known as Plan C, the internal project is focused on vexing problems such as the distressed commercial real estate markets, the high rate of delinquencies among homeowners, and the struggles of community and regional banks, said government sources familiar with the effort."A lot of scrutiny and a leap of faith"? More of the later, not enough of the former. It didn't take much "scrutiny" to understand there was substantial overbuilding in CRE, especially for retail space and for hotels. And yet banks kept making loans in 2006, 2007 and even in 2008 ...
...
The team is also responsible for considering potential government responses, but top officials within the Obama administration are wary of rolling out initiatives that would commit massive amounts of federal resources ...
The officials in charge of Plan C -- named to allude to a last line of defense -- face a particular challenge in addressing the breakdown of commercial real estate lending. ... these groups face a tidal wave of commercial real estate debt -- some estimates peg the total at more than $3 trillion -- that they will need to refinance. ...
Thousands of these institutions wrote billions of dollars in mortgages on strip malls, doctors offices and drive-through restaurants. These commercial loans required a lot of scrutiny and a leap of faith, and, for much of the decade, the smaller banks that leapt were rewarded with outsize profits.
In doing so, many took on bigger and bigger risks. By the beginning of the recession in December 2007, the median midsize bank held commercial real estate loans worth 3.55 times its capital cushion -- its reserve against unexpected losses -- according to the Federal Deposit Insurance Corp.
... Another issue identified by the Plan C team is homeowner delinquencies, which continue to rise as large numbers of people lose their jobs and miss monthly payments.
Wednesday, July 08, 2009
Consumer Credit Declines in May
by Calculated Risk on 7/08/2009 03:00:00 PM
From MarketWatch: May consumer credit down in fourth straight month
U.S. consumers reduced their debt in May for the fourth consecutive month, the Federal Reserve reported Wednesday. Total seasonally adjusted consumer debt fell $3.22 billion ... Consumer credit fell in eight of the past ten months. ... This is the longest string of declines in credit since 1991. Credit-card debt had the biggest drop in May, falling $2.86 billion, or 3.7% to $928 billion.
 Click on graph for larger image in new window.
This graph shows the year-over-year (YoY) change in consumer credit. Consumer credit is off 1.8% over the last 12 months. The record YoY decline was 1.9% in 1991 - and that record will be broken over the next couple of months.
Note: Consumer credit does not include real estate debt.


