 RSS Feed
 by Calculated Risk on 3/23/2011 10:00:00 AM
Showing posts with label New home inventory. Show all posts
Showing posts with label New home inventory. Show all posts
Wednesday, March 23, 2011
New Home Sales Fall to Record Low in February
The Census Bureau reports New Home Sales in February were at a seasonally adjusted annual rate (SAAR) of 250 thousand. This was down from a revised 301 thousand in January.
 Click on graph for larger image in graph gallery.
The first graph shows New Home Sales vs. recessions since 1963. The dashed line is the current sales rate.
Sales of new single-family houses in February 2011 were at a seasonally adjusted annual rate of 250,000 ... This is 16 9 percent 16.9 (±19.1%)* below the revised January rate of 301,000 and is 28.0 percent (±14.8%) below the February 2010 estimate of 347,000.And a long term graph for New Home Months of Supply:
 Months of supply increased to 8.9 in February from 7.4 months in January. The all time record was 12.1 months of supply in January 2009. This is very high (less than 6 months supply is normal).
The seasonally adjusted estimate of new houses for sale at the end of February was 186,000. This represents a supply of 8.9 months at the current sales rate.On inventory, according to the Census Bureau:
"A house is considered for sale when a permit to build has been issued in permit-issuing places or work has begun on the footings or foundation in nonpermit areas and a sales contract has not been signed nor a deposit accepted."Starting in 1973 the Census Bureau broke this down into three categories: Not Started, Under Construction, and Completed.
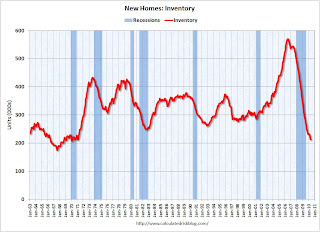
 This graph shows the three categories of inventory starting in 1973.
The inventory of completed homes for sale fell to 76,000 units in February. The combined total of completed and under construction is at the lowest level since this series started.
 The last graph shows sales NSA (monthly sales, not seasonally adjusted annual rate).
In February 2010 (red column), 19 thousand new homes were sold (NSA). This is a new record low for the month of February.
The previous record low for February was 27 thousand in 2010. The high was 109 thousand in 2005.
This was a new record low sales rate and well below the consensus forecast of 290 thousand homes sold (SAAR). Another very weak report ...
Thursday, February 24, 2011
New Home Sales decrease in January
by Calculated Risk on 2/24/2011 10:00:00 AM
The Census Bureau reports New Home Sales in January were at a seasonally adjusted annual rate (SAAR) of 284 thousand. This is down from a revised 325 thousand in December.
 Click on graph for larger image in new window.
The first graph shows New Home Sales vs. recessions since 1963. The dashed line is the current sales rate.
Sales of new single-family houses in January 2011 were at a seasonally adjusted annual rate of 284,000 ... This is 12 6 12.6 percent (±11.2%) below the revised December rate of 325,000 and is 18.6 percent (±15.4%) below the January 2010 estimate of 349,000.And a long term graph for New Home Months of Supply:
 Months of supply increased to 7.9 in January from 7.0 months in December. The all time record was 12.1 months of supply in January 2009. This is still high (less than 6 months supply is normal).
The seasonally adjusted estimate of new houses for sale at the end of January was 188,000. This represents a supply of 7.9 months at the current sales rate.On inventory, according to the Census Bureau:
"A house is considered for sale when a permit to build has been issued in permit-issuing places or work has begun on the footings or foundation in nonpermit areas and a sales contract has not been signed nor a deposit accepted."Starting in 1973 the Census Bureau broke this down into three categories: Not Started, Under Construction, and Completed.
 This graph shows the three categories of inventory starting in 1973.
The inventory of completed homes for sale fell to 78,000 units in January. And the combined total of completed and under construction is at the lowest level since this series started.
This is the "good" news - in most areas the 'completed' and 'under construction' inventory of new homes is fairly lean.
 The last graph shows sales NSA (monthly sales, not seasonally adjusted annual rate).
In January 2010 (red column), 19 thousand new homes were sold (NSA). This is a new record low for the month of January.
The previous record low for January was 24 thousand in 2009 and 2010.
This was below the consensus forecast of 310 thousand homes sold (SAAR).
New home sales have averaged 293 thousand per month (annual rate) over the last nine months - all below the previous record low. Another very weak report ...
Wednesday, January 26, 2011
New Home Sales increase in December
by Calculated Risk on 1/26/2011 10:00:00 AM
The Census Bureau reports New Home Sales in December were at a seasonally adjusted annual rate (SAAR) of 329 thousand. This is up from a revised 280 thousand in November.
 Click on graph for larger image in new window.
The first graph shows monthly new home sales (NSA - Not Seasonally Adjusted or annualized).
Note the Red columns for 2010. In December 2010, 22 thousand new homes were sold (NSA). This is a new record low for the month of December.
The previous record low for December was 23 thousand in 1966; the record high was 87 thousand in December 2005.
 The second graph shows New Home Sales vs. recessions since 1963. The dashed line is the current sales rate.
Sales of new single-family houses in December 2010 were at a seasonally adjusted annual rate of 329,000 ... This is 17.5 percent (±17.7%)* above the revised November rate of 280,000, but is 7.6 percent (±17.0%)* below the December 2009 estimate of 356,000.And another long term graph - this one for New Home Months of Supply.
 Months of supply decreased to 6.9 in December from 8.4 in November. The all time record was 12.1 months of supply in January 2009. This is still high (less than 6 months supply is normal).
The seasonally adjusted estimate of new houses for sale at the end of December was 190,000. This represents a supply of 6.9 months at the current sales rate.
 The final graph shows new home inventory.
 The 329 thousand annual sales rate for December is still very low, and this was just the weakest December on record. This was above the consensus forecast of 300 thousand homes sold (SAAR).
It says something when sales increase and are still below the previous record lows for all years prior to 2010. New Home sales are still bouncing along the bottom - the good news is inventory is still declining.
Thursday, December 23, 2010
New Home Sales weak in November
by Calculated Risk on 12/23/2010 10:00:00 AM
The Census Bureau reports New Home Sales in November were at a seasonally adjusted annual rate (SAAR) of 290 thousand. This is up from a revised 275 thousand in October.
 Click on graph for larger image in new window.
The first graph shows monthly new home sales (NSA - Not Seasonally Adjusted or annualized).
Note the Red columns for 2010. In November 2010, 21 thousand new homes were sold (NSA). This is a new record low for November.
The previous record low for the month of November was 26 thousand in 1966 and 2009; the record high was 86 thousand in November 2005.
 The second graph shows New Home Sales vs. recessions since 1963. The dashed line is the current sales rate.
Sales of new single-family houses in November 2010 were at a seasonally adjusted annual rate of 290,000 ... This is 5.5 percent (±16.2%)* above the revised October rate of 275,000, but is 21.2 percent (±13.3%) below the November 2009 estimate of 368,000And another long term graph - this one for New Home Months of Supply.
 Months of supply decreased to 8.2 in November from 8.8 in October. The all time record was 12.4 months of supply in January 2009. This is still high (less than 6 months supply is normal).
The seasonally adjusted estimate of new houses for sale at the end of November was 197,000. This represents a supply of 8.2 months at the current sales rate.
 The final graph shows new home inventory.
 The 290 thousand annual sales rate for November is just above the all time record low in August (274 thousand). This was the weakest November on record and below the consensus forecast of 300 thousand.
This was another very weak report.
Wednesday, November 24, 2010
New Home Sales decline in October
by Calculated Risk on 11/24/2010 10:00:00 AM
The Census Bureau reports New Home Sales in October were at a seasonally adjusted annual rate (SAAR) of 283 thousand. This is down from 308 thousand in September.
 Click on graph for larger image in new window.
The first graph shows monthly new home sales (NSA - Not Seasonally Adjusted or annualized).
Note the Red columns for 2010. In October 2010, 23 thousand new homes were sold (NSA). This is a new record low for October.
The previous record low for the month of October was 29 thousand in 1981; the record high was 105 thousand in October 2005.
 The second graph shows New Home Sales vs. recessions for the last 47 years. The dashed line is the current sales rate.
Sales of new single-family houses in October 2010 were at a seasonally adjusted annual rate of 283,000, according to estimates released jointly today by the U.S. Census Bureau and the Department of Housing and Urban Development. This is 8.1 percent (±16.1%)* below the revised September rate of 308,000 and is 28.5 percent (±12.6%) below the October 2009 estimate of 396,000.And another long term graph - this one for New Home Months of Supply.
 Months of supply increased to 8.6 in October from 7.9 in September. The all time record was 12.4 months of supply in January 2009. This is still high (less than 6 months supply is normal).
The seasonally adjusted estimate of new houses for sale at the end of October was 202,000. This represents a supply of 8.6 months at the current sales rate.
 The final graph shows new home inventory.
 The 283 thousand annual sales rate for October is just above the all time record low in August (275 thousand). This was the weakest October on record and well below the consensus forecast of 314 thousand.
This was another very weak report.
Wednesday, October 27, 2010
New Home Sales increased slightly in September, still near record low
by Calculated Risk on 10/27/2010 10:00:00 AM
The Census Bureau reports New Home Sales in September were at a seasonally adjusted annual rate (SAAR) of 307 thousand. This is slightly higher than in August (288 thousand SAAR).
 Click on graph for larger image in new window.
The first graph shows monthly new home sales (NSA - Not Seasonally Adjusted or annualized).
Note the Red columns for 2010. In September 2010, 24 thousand new homes were sold (NSA). This is a new record low for September.
The previous record low for the month of September was 28 thousand in 1981; the record high was 95 thousand in September 2005.
 The second graph shows New Home Sales vs. recessions for the last 47 years. The dashed line is the current sales rate.
Sales of new single-family houses in September 2010 were at a seasonally adjusted annual rate of 307,000, according to estimates released jointly today by the U.S. Census Bureau and the Department of Housing and Urban Development. This is 6.6 percent (±16.9%)* above the revised August rate of 288,000, but is 21.5 percent (±13.3%) below the September 2009 estimate of 391,000.And another long term graph - this one for New Home Months of Supply.
 Months of supply decreased to 8.0 in September from 8.6 in August. The all time record was 12.4 months of supply in January 2009. This is still high (less than 6 months supply is normal).
The seasonally adjusted estimate of new houses for sale at the end of September was 204,000. This represents a supply of 8.0 months at the current sales rate.
 The final graph shows new home inventory.
 The 307 thousand annual sales rate for September is just above the all time record low in May (282 thousand). This was the weakest September on record.
New home sales are important for the economy and jobs - and this indicates that residential investment will be a sharp drag on GDP in Q3.
Friday, September 24, 2010
New Home Sales: Unchanged from July, Worst August on Record
by Calculated Risk on 9/24/2010 10:00:00 AM
NOTE: My host (Google) is not uploading images this morning - I'm working on a fix. You can follow the links to the images.
The Census Bureau reports New Home Sales in August were at a seasonally adjusted annual rate (SAAR) of 288 thousand. This is unchanged from July.
Here is the graph for New Home Sales NSA.
The first graph shows monthly new home sales (NSA - Not Seasonally Adjusted or annualized).
Note the Red columns for 2010. In August 2010, 25 thousand new homes were sold (NSA). This is a new record low for August.
The previous record low for the month of August was 34 thousand in 1981; the record high was 110 thousand in August 2005.
The second graph shows New Home Sales vs. recessions for the last 47 years.
Sales of new single-family houses in August 2010 were at a seasonally adjusted annual rate of 288,000, according to estimates released jointly today by the U.S. Census Bureau and the Department of Housing and Urban Development. This is unchanged (±16.7%)* from the revised July rate of 288,000 and is 28.9 percent (±11.0%) below the August 2009 estimate of 405,000.And another long term graph - this one for New Home Months of Supply.
The third graph is for Months of Supply
Months of supply decreased to 8.6 in August from 8.7 in July. The all time record was 12.4 months of supply in January 2009. This is still very high (less than 6 months supply is normal).
The seasonally adjusted estimate of new houses for sale at the end of August was 206,000. This represents a supply of 8.6 months at the current sales rate.The final graph shows new home inventory.
The 288 thousand annual sales rate for August is just above the all time record low in May (282 thousand). This was another very weak report. New home sales are important for the economy and jobs - and this indicates that residential investment will be a sharp drag on GDP in Q3.
Note: Sorry for the technical problems.
Wednesday, August 25, 2010
New Home Sales decline to Record Low in July
by Calculated Risk on 8/25/2010 10:00:00 AM
The Census Bureau reports New Home Sales in July were at a seasonally adjusted annual rate (SAAR) of 276 thousand. This is an decrease from the record low of 315 thousand in June (revised down from 330 thousand).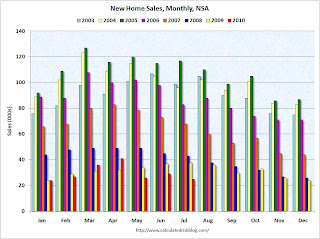 Click on graph for larger image in new window.
The first graph shows monthly new home sales (NSA - Not Seasonally Adjusted or annualized).
Note the Red columns for 2010. In July 2010, 25 thousand new homes were sold (NSA). This is a new record low for July.
The previous record low for the month of July was 31 thousand in 1982; the record high was 117 thousand in July 2005. The second graph shows New Home Sales vs. recessions for the last 47 years.
Sales of new single-family houses in July 2010 were at a seasonally adjusted annual rate of 276,000, according to estimates released jointly today by the U.S. Census Bureau and the Department of Housing and Urban Development. This is 12.4 percent (±10.8%) below the revised June rate of 315,000 and is 32.4 percent (±8.7%) below the July 2009 estimate of 408,000.And another long term graph - this one for New Home Months of Supply.
 Months of supply increased to 9.1 in July from 8.0 in June. The all time record was 12.4 months of supply in January 2009. This is still very high (less than 6 months supply is normal).
The seasonally adjusted estimate of new houses for sale at the end of July was 210,000. This represents a supply of 9.1 months at the current sales rate.
 The final graph shows new home inventory.
 The 276 thousand annual sales rate for July is the all time record low (May was revised up a little). This was another very weak report. New home sales are important for the economy and jobs - and this indicates that residential investment will be a sharp drag on GDP in Q3.
Monday, July 26, 2010
Home builders to start building more homes?
by Calculated Risk on 7/26/2010 09:13:00 PM
The following article discusses both new and existing home supply. Here is a short excerpt on new homes ...
From Robbie Whelan at the WSJ: Supply of Homes Set to Grow
Home builders ... are stuck with thousands of acres that are prone to lose value as the market struggles. Many will build homes on the land, rather than write off its value and wait for the market to improve.In some communities with excess supply, home builders are competing with the distressed sales by building smaller homes. As an example, a couple months ago David Streitfeld at the NY Times wrote about a building boom in Las Vegas: In City of Homes That Sit Empty, Building Booms
... "They're discounting the homes, they're making very small profit margins, but they're building homes." [said Brad Hunter, chief economist at Metrostudy]
...
Other indicators also point to builders preparing to increase home construction, despite lagging sales. The number of finished vacant lots, or parcels of land that have been developed and readied for building, stands at about 1.2 million nationwide, according to Metrostudy, or just 5% below the peak in late 2008.
Home prices in Las Vegas are down by 60 percent from 2006 in one of the steepest descents in modern times. There are 9,517 spanking new houses sitting empty. An additional 5,600 homes were repossessed by lenders in the first three months of this year and could soon be for sale.But just because they have the lots, I hope they don't start overbuilding again.
Yet builders here are putting up 1,100 homes, and they are frantically buying lots for even more. ... Land and labor costs have fallen significantly, so the newest homes are competitively priced.
New Home Sales: Worst June on Record
by Calculated Risk on 7/26/2010 10:00:00 AM
Ignore all the month to previous month comparisons. May was revised down sharply and that makes the increase look significant. Here is the bottom line: this was the worst June for new home sales on record.
The Census Bureau reports New Home Sales in June were at a seasonally adjusted annual rate (SAAR) of 330 thousand. This is an increase from the record low of 267 thousand in May (revised from 300 thousand). Click on graph for larger image in new window.
The first graph shows monthly new home sales (NSA - Not Seasonally Adjusted).
Note the Red columns for 2010. In June 2010, 30 thousand new homes were sold (NSA). This is a new record low for June.
The previous record low for the month of June was 34 thousand in 1982; the record high was 115 thousand in June 2005.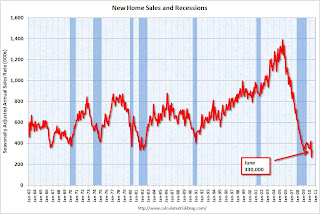 The second graph shows New Home Sales vs. recessions for the last 47 years.
Sales of new single-family houses in June 2010 were at a seasonally adjusted annual rate of 330,000 ... This is 23.6 percent (±15.3%) above the revised May rate of 267,000, but is 16.7 percent (±10.9%) below the June 2009 estimate of 396,000.And another long term graph - this one for New Home Months of Supply.
 Months of supply decreased to 7.6 in June from a revised 9.6 in May (revised from 8.5). The all time record was 12.4 months of supply in January 2009. This is still very high (less than 6 months supply is normal).
 The seasonally adjusted estimate of new houses for sale at the end of June was 210,000. This represents a supply of 7.6 months at the current sales rate.
 The final graph shows new home inventory.
 The 267 thousand annual sales rate for May is the all time record. This is a very sharp downward revision.
The 330 thousand in June is the worst June on record. With all the gyrations, it is difficult to see what is happening month to month, but overall this was a very weak report.
Sunday, June 27, 2010
Housing Supply Metrics
by Calculated Risk on 6/27/2010 08:13:00 PM
Here is a table of various housing supply measures (just putting this in one place with links to the source data).
Note: here is the Weekly Summary and a Look Ahead. It will be a busy week!
| Total delinquent loans1 | 7.3 million |
| Seriously delinquent loans1,2 | 5.0 million |
| Total REO Inventory3 | 0.5 million |
| Fannie, Freddie, FHA REO4 | 210 thousand |
| Homeowners with Negative Equity5 | 11.2 million |
| Homeowner vacancy rate6 | 2.6% |
| Rental vacancy rate6 | 10.6% |
| Excess Vacant Units6,7 | 1.7 million |
| Existing Home Inventory8 | 3.89 million |
| Existing Home Months of Supply8 | 8.3 months |
| New Home Inventory9 | 213 thousand |
| New Home Months of Supply9 | 8.5 months |
1 Source: estimate based on the Mortgage Bankers Association’s (MBA) Q1 2010 National Delinquency Survey. "MBA’s National Delinquency Survey covers about 44.4 million first lien mortgages on one-to four-unit residential properties ... The NDS is estimated to cover around 85 percent of the outstanding first-lien mortgages in the country."
2 This is based on the MBA's estimate of loans 90+ days delinquent or in the foreclosure process.
3 Source: Radarlogic and Barclays as of Feb 2010.
4 Source: Fannie Mae, Freddie Mac and FHA. Fannie, Freddie, FHA REO Inventory Surges 22% in Q1 2010
5 Source: CoreLogic Q1 2010 Negative Equity Report
6 Source: Census Bureau Residential Vacancies and Homeownership in the First Quarter 2010
7 CR calculation.
8 Source: National Association of Realtors
9 Source: Census Bureau New Residential sales
Wednesday, June 23, 2010
New Home Sales collapse to Record Low in May
by Calculated Risk on 6/23/2010 10:00:00 AM
The Census Bureau reports New Home Sales in May were at a seasonally adjusted annual rate (SAAR) of 300 thousand. This is a sharp decrease from the revised rate of 446 thousand in April (revised from 504 thousand). Click on graph for larger image in new window.
The first graph shows monthly new home sales (NSA - Not Seasonally Adjusted).
Note the Red columns for 2010. In May 2010, 28 thousand new homes were sold (NSA). This is a new record low.
The previous record low for the month of May was 34 thousand in 2009; the record high was 120 thousand in May 2005. The second graph shows New Home Sales vs. recessions for the last 45 years.
Sales of new single-family houses in May 2010 were at a seasonally adjusted annual rate of 300,000 ... This is 32.7 percent (±9.9%) below the revised April rate of 446,000 and is 18.3 percent (±13.0%) below the May 2009 estimate of 367,000.And another long term graph - this one for New Home Months of Supply.
 Months of supply increased to 8.5 in May from 5.8 April. The all time record was 12.4 months of supply in January 2009. Since the sales rate declined sharply, the months of supply increased - this is still very high (less than 6 months supply is normal).
 The seasonally adjusted estimate of new houses for sale at the end of May was 213,000. This represents a supply of 8.5 months at the current sales rate.
 The final graph shows new home inventory.
 New home sales are counted when the contract is signed, so the tax credit related pickup in sales activity happened in April. This pulled demand forward, and April was probably the peak for new home sales this year.
The 300 thousand annual sales rate is a new all time record low. The previous record low annual sales rate was 338 thousand in September 1981.
Wednesday, May 26, 2010
New Home Sales increase to 504K Annual Rate in April
by Calculated Risk on 5/26/2010 10:00:00 AM
The Census Bureau reports New Home Sales in April were at a seasonally adjusted annual rate (SAAR) of 504 thousand. This is an increase from the revised rate of 439 thousand in March (revised from 411 thousand). Click on graph for larger image in new window.
The first graph shows monthly new home sales (NSA - Not Seasonally Adjusted).
Note the Red columns for 2010. In April 2010, 48 thousand new homes were sold (NSA).
The record low for the month of April was 32 thousand in 1982 and 2009; the record high was 116 thousand in 2005. The second graph shows New Home Sales vs. recessions for the last 45 years.
Sales of new one-family houses in April 2010 were at a seasonally adjusted annual rate of 504,000 ... This is 14.8 percent (±19.5%)* above the revised March rate of 439,000 and is 47.8 percent (±26.0%) above the April 2009 estimate of 341,000.And another long term graph - this one for New Home Months of Supply.
 Months of supply declined to 5.0 in April from 6.2 in March. This is significantly below the all time record of 12.4 months of supply set in January 2009. This would be about normal, except the months of supply will increase next month when sales decline.
The seasonally adjusted estimate of new houses for sale at the end of April was 211,000. This represents a supply of 5.0 months at the current sales rate.
 The final graph shows new home inventory.
 New home sales are counted when the contract is signed, so this pickup in activity is related to the tax credit.
For new home sales, the tax credit selling ended in April and sales will probably decline sharply in May.
Friday, April 23, 2010
New Home Sales at 411K in March
by Calculated Risk on 4/23/2010 10:00:00 AM
The Census Bureau reports New Home Sales in March were at a seasonally adjusted annual rate (SAAR) of 411 thousand. This is an increase from the revised rate of 324 thousand in February (revised from 308 thousand). Click on graph for larger image in new window.
The first graph shows monthly new home sales (NSA - Not Seasonally Adjusted).
Note the Red columns for 2010. In March 2010, 38 thousand new homes were sold (NSA).
The record low for March was 31 thousand in 2009.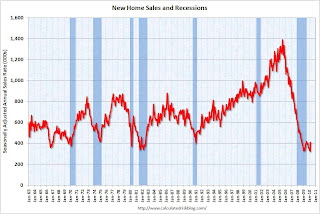 The second graph shows New Home Sales vs. recessions for the last 45 years.
Sales of new single-family houses in March 2010 were at a seasonally adjusted annual rate of 411,000 ... This is 26.9 percent (±21.1%) above the revised February rate of 324,000 and is 23.8 percent (±18.7%) above the March 2009 estimate of 332,000.And another long term graph - this one for New Home Months of Supply.
 Months of supply declined to 6.7 in March from 8.6 in February. This is significantly below the all time record of 12.4 months of supply set in January 2009, but still higher than normal.
The seasonally adjusted estimate of new houses for sale at the end of March was 228,000. This represents a supply of 6.7 months at the current sales rate.
 The final graph shows new home inventory.
 New home sales are counted when the contract is signed, so this pickup in activity is probably related to the tax credit. Note that that a few thousand extra sales NSA in March can make a huge difference in the SAAR.
Any further pickup in sales because of the tax credit will happen in April and then sales will probably decline again.
Wednesday, March 24, 2010
New Home Sales at Record Low in February
by Calculated Risk on 3/24/2010 10:00:00 AM
The Census Bureau reports New Home Sales in February were at a seasonally adjusted annual rate (SAAR) of 308 thousand. This is a new record low and a decrease from the revised rate of 315 thousand in January (revised from 309 thousand). Click on graph for larger image in new window.
The first graph shows monthly new home sales (NSA - Not Seasonally Adjusted).
Note the Red columns for 2010. In February 2010, 24 thousand new homes were sold (NSA).
This is below the previous record low of 29 thousand hit three times; in February 2009, 1982 and 1970. The second graph shows New Home Sales vs. recessions for the last 45 years. New Home sales fell off a cliff, but after increasing slightly, are now 6% below the previous record low in January 2009.
Sales of new single-family houses in February 2010 were at a seasonally adjusted annual rate of 308,000, according to estimates released jointly today ... This is 2.2 percent (±15.3%)* below the revised January rate of 315,000 and is 13.0 percent (±12.2%) below the February 2009 estimate of 354,000.And another long term graph - this one for New Home Months of Supply.
 There were 9.2 months of supply in February. Rising, but still significantly below the all time record of 12.4 months of supply set in January 2009.
The seasonally adjusted estimate of new houses for sale at the end of February was 236,000. This represents a supply of 9.2 months at the current sales rate.
 The final graph shows new home inventory.
 Note that new home inventory does not include many condos (especially high rise condos), and areas with significant condo construction will have much higher inventory levels.
New home sales are far more important for the economy than existing home sales, and new home sales will remain under pressure until the overhang of excess housing inventory declines much further. Obviously this is another extremely weak report.
Wednesday, February 24, 2010
New Home Sales fall to Record Low in January
by Calculated Risk on 2/24/2010 10:15:00 AM
Note: See previous post for video and discussion of Bernanke's testimony.
The Census Bureau reports New Home Sales in January were at a seasonally adjusted annual rate (SAAR) of 309 thousand. This is a record low and a sharp decrease from the revised rate of 348 thousand in December. Click on graph for larger image in new window.
The first graph shows monthly new home sales (NSA - Not Seasonally Adjusted).
Note the Red column for 2010. In January 2010, 21 thousand new homes were sold (NSA).
This is below the previous record low of 24 thousand in January 2009. The second graph shows New Home Sales vs. recessions for the last 45 years. New Home sales fell off a cliff, but after increasing slightly, are now 6% below the previous record low in January 2009.
Sales of new single-family houses in January 2010 were at a seasonally adjusted annual rate of 309,000 ... This is 11.2 percent (±14.0%)* below the revised December rate of 348,000 and is 6.1 percent (±15.1%)* below the January 2009 estimate of 329,000.And another long term graph - this one for New Home Months of Supply.
 There were 9.1 months of supply in January. Rising, but still significantly below the all time record of 12.4 months of supply set in January 2009.
The seasonally adjusted estimate of new houses for sale at the end of January was 234,000. This represents a supply of 9.1 months at the current sales rate.
 The final graph shows new home inventory.
 Note that new home inventory does not include many condos (especially high rise condos), and areas with significant condo construction will have much higher inventory levels.
Months-of-supply and inventory have both peaked for this cycle, but sales have set a new record low. New home sales are far more important for the economy than existing home sales, and new home sales will remain under pressure until the overhang of excess housing inventory declines much further.
Obviously this is another extremely weak report.


