 RSS Feed
 by Calculated Risk on 5/02/2024 08:16:00 PM
Thursday, May 02, 2024
Friday: Employment Report
 Note: Mortgage rates are from MortgageNewsDaily.com and are for top tier scenarios.
Friday:
• At 8:30 AM ET, Employment Report for April. The consensus is for 210,000 jobs added, and for the unemployment rate to be unchanged at 3.8%.
• At 10:00 AM, the ISM Services Index for April. The consensus is for a reading of 52.0, up from 51.4.
April Employment Preview
by Calculated Risk on 5/02/2024 02:57:00 PM
On Friday at 8:30 AM ET, the BLS will release the employment report for April. The consensus is for 210,000 jobs added, and for the unemployment rate to be unchanged at 3.8%.
There were 303,000 jobs added in March, and the unemployment rate was at 3.8%.
From Goldman Sachs economist Spencer Hill
We estimate nonfarm payrolls rose by 275k in April ... Our forecast reflects a favorable evolution in the April seasonal factors and a continued boost from above-normal immigration. ... We estimate that the unemployment rate edged down but was unchanged on a rounded basis at 3.8%From BofA:
emphasis added
We look for another month of solid job gains in the April employment report this week. We expect nonfarm payrolls to rise by 250k on the month, with private sector job gains totaling 200k. Elsewhere, we expect the unemployment rate, weekly hours, and the participation rate to hold steady at 3.8%, 34.4, and 62.7%, respectively.• ADP Report: The ADP employment report showed 192,000 private sector jobs were added in April. This was above consensus forecasts and suggests job gains slightly above consensus expectations, however, in general, ADP hasn't been very useful in forecasting the BLS report.
• ISM Surveys: Note that the ISM indexes are diffusion indexes based on the number of firms hiring (not the number of hires). The ISM® manufacturing employment index increased to 48.6%, up from 47.4% the previous month. This would suggest about 20,000 jobs lost in manufacturing. The ADP report indicated 9,000 manufacturing jobs added in April.
The ISM® services employment index will be released tomorrow.
• Unemployment Claims: The weekly claims report showed the same number of initial unemployment claims during the reference week from 212,000 in March to 212,000 in April. This suggests a similar number of layoffs in April compared to March.
• COVID: As far as the pandemic, the number of patients hospitalized during the reference week in April was around 6,000, down from 10,000 in March.
• Conclusion: My guess is employment gains will be above consensus expectations.
Realtor.com Reports Active Inventory Up 33.3% YoY; New Listings Up 10.4% YoY
by Calculated Risk on 5/02/2024 12:54:00 PM
What this means: On a weekly basis, Realtor.com reports the year-over-year change in active inventory and new listings. On a monthly basis, they report total inventory. For April, Realtor.com reported inventory was up 30.4% YoY, but still down almost 36% compared to April 2017 to 2019 levels.
Now - on a weekly basis - inventory is up 33.3% YoY.
Realtor.com has monthly and weekly data on the existing home market. Here is their weekly report: Weekly Housing Trends View—Data Week Ending April 27, 2024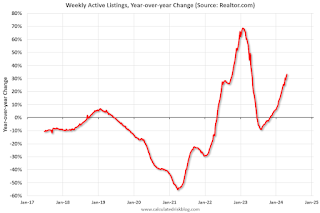 Here is a graph of the year-over-year change in inventory according to realtor.com.
Inventory was up year-over-year for the 25th consecutive week.
Realtor.com has monthly and weekly data on the existing home market. Here is their weekly report: Weekly Housing Trends View—Data Week Ending April 27, 2024
• Active inventory increased, with for-sale homes 33.3% above year-ago levels.
For the 25th straight week, there were more homes listed for sale versus the prior year, giving homebuyers more options. As mortgage rates have climbed to new 2024 highs, we could see sellers adjust their plans, since nearly three-quarters of potential sellers also plan to buy a home.
• New listings–a measure of sellers putting homes up for sale–were up this week, by 10.4% from one year ago.
Since February, the number of homes newly listed for sale has surpassed year ago pace by double-digit with the exception of a few weeks around this year’s spring holidays. As reported in the Realtor.com April housing report, newly listed homes trailed behind every prior year except for the pandemic-induced starting point of 2020 and the record low of 2023.
 Here is a graph of the year-over-year change in inventory according to realtor.com.
 Inventory was up year-over-year for the 25th consecutive week.
However, inventory is still historically very low.
New listings remain below typical pre-pandemic levels although increasing.
Lawler: Update on Mortgage Rates and Spreads and also New / Renewal Rents
by Calculated Risk on 5/02/2024 08:48:00 AM
Today, in the Calculated Risk Real Estate Newsletter: Lawler: Update on Mortgage Rates and Spreads and also New / Renewal Rents
A brief excerpt:
As I’ve written about before, that “new” vs. “renewal” rent growth gap has been observed by publicly-traded companies that are in the residential rental business.
On that score, here are some data from Invitation Homes quarterly earnings supplement on rent growth trends.
Note that while rent increases on new leases were extremely low over the last two quarter, rents on renewals, while down from 2022, were still rising at a relatively rapid pace.

There is much more in the article.
Trade Deficit at $69.4 Billion in March
by Calculated Risk on 5/02/2024 08:46:00 AM
The Census Bureau and the Bureau of Economic Analysis reported:
The U.S. Census Bureau and the U.S. Bureau of Economic Analysis announced today that the goods and services deficit was $69.4 billion in March, down $0.1 billion from $69.5 billion in February, revised.
March exports were $257.6 billion, $5.3 billion less than February exports. March imports were $327.0 billion, $5.4 billion less than February imports.
emphasis added
 Click on graph for larger image.
Both exports imports decreased in March.
Exports are unchanged year-over-year; imports are up 3.1% year-over-year.
Both imports and exports decreased sharply due to COVID-19 and then bounced back - imports and exports have generally increased recently.
The second graph shows the U.S. trade deficit, with and without petroleum.
 The blue line is the total deficit, and the black line is the petroleum deficit, and the red line is the trade deficit ex-petroleum products.
Note that net, exports of petroleum products are positive and have been increasing.
The trade deficit with China increased to $17.2 billion from $16.6 billion a year ago.
Weekly Initial Unemployment Claims at 208,000
by Calculated Risk on 5/02/2024 08:30:00 AM
The DOL reported:
In the week ending April 27, the advance figure for seasonally adjusted initial claims was 208,000, unchanged from the previous week's revised level. The previous week's level was revised up by 1,000 from 207,000 to 208,000. The 4-week moving average was 210,000, a decrease of 3,500 from the previous week's revised average. The previous week's average was revised up by 250 from 213,250 to 213,500.The following graph shows the 4-week moving average of weekly claims since 1971.
emphasis added
 Click on graph for larger image.
The dashed line on the graph is the current 4-week average. The four-week average of weekly unemployment claims decreased to 210,000.
The previous week was revised up.
Weekly claims were lower than the consensus forecast.
Wednesday, May 01, 2024
Thursday: Unemployment Claims, Trade Deficit
by Calculated Risk on 5/01/2024 08:57:00 PM
 Note: Mortgage rates are from MortgageNewsDaily.com and are for top tier scenarios.
Thursday:
• At 8:30 AM ET, The initial weekly unemployment claims report will be released. The consensus is for 210 thousand initial claims, up from 207 thousand last week.
• Also at 8:30 AM: Trade Balance report for March from the Census Bureau. The consensus is the trade deficit to be $68.8 billion. The U.S. trade deficit was at $68.9 billion in February.
Vehicles Sales Increase to 15.7 million SAAR in April; Up Slightly YoY
by Calculated Risk on 5/01/2024 07:33:00 PM
Wards Auto released their estimate of light vehicle sales for April: U.S. Light-Vehicle Sales Trudge Along with Tepid Growth in April (pay site).
Affordability continued to dominate the sales mix as gains in entry-price CUV and car segments more than offset downturns recorded in most other segments. While the SAAR and the daily selling rate were up, raw volume declined year-over-year due to April 2024 having one fewer selling day than in 2023. Sales in the first four months of 2024 totaled 5.1 million units, up 3% from January-April 2023’s 4.9 million.
 Click on graph for larger image.
This graph shows light vehicle sales since 2006 from the BEA (blue) and Wards Auto's estimate for April (red).
Sales in April (15.74 million SAAR) were up 1.6% from March, and up 0.4% from April 2023.
 Sales in April were slightly above the consensus forecast.
Construction Spending Decreased 0.2% in March
by Calculated Risk on 5/01/2024 02:57:00 PM
From the Census Bureau reported that overall construction spending increased:
Construction spending during March 2024 was estimated at a seasonally adjusted annual rate of $2,083.9 billion, 0.2 percent below the revised February estimate of $2,087.8 billion. The March figure is 9.6 percent above the March 2023 estimate of $1,901.4 billion.Private spending decreased and public spending increased:
emphasis added
Spending on private construction was at a seasonally adjusted annual rate of $1,600.8 billion, 0.5 percent below the revised February estimate of $1,608.5 billion. ...
In March, the estimated seasonally adjusted annual rate of public construction spending was $483.1 billion, 0.8 percent above the revised February estimate of $479.3 billion
 Click on graph for larger image.
This graph shows private residential and nonresidential construction spending, and public spending, since 1993. Note: nominal dollars, not inflation adjusted.
Residential (red) spending is 8.8% below the recent peak in 2022.
Non-residential (blue) spending is 1.1% below the peak two months ago.
Public construction spending is 1.1% below the peak three months ago.
 The second graph shows the year-over-year change in construction spending.
On a year-over-year basis, private residential construction spending is up 4.4%. Non-residential spending is up 11.1% year-over-year. Public spending is up 17.9% year-over-year.
This was below consensus expectations for 0.3% increase in spending, and total construction spending for the previous two months was revised down. This is probably just the start of weakness for private non-residential construction.
FOMC Statement: No Change to Fed Funds Rate, "lack of further progress" on Inflation
by Calculated Risk on 5/01/2024 02:00:00 PM
Recent indicators suggest that economic activity has continued to expand at a solid pace. Job gains have remained strong, and the unemployment rate has remained low. Inflation has eased over the past year but remains elevated. In recent months, there has been a lack of further progress toward the Committee's 2 percent inflation objective.
The Committee seeks to achieve maximum employment and inflation at the rate of 2 percent over the longer run. The Committee judges that the risks to achieving its employment and inflation goals have moved toward better balance over the past year. The economic outlook is uncertain, and the Committee remains highly attentive to inflation risks.
In support of its goals, the Committee decided to maintain the target range for the federal funds rate at 5-1/4 to 5-1/2 percent. In considering any adjustments to the target range for the federal funds rate, the Committee will carefully assess incoming data, the evolving outlook, and the balance of risks. The Committee does not expect it will be appropriate to reduce the target range until it has gained greater confidence that inflation is moving sustainably toward 2 percent. In addition, the Committee will continue reducing its holdings of Treasury securities and agency debt and agency mortgage‑backed securities. Beginning in June, the Committee will slow the pace of decline of its securities holdings by reducing the monthly redemption cap on Treasury securities from $60 billion to $25 billion. The Committee will maintain the monthly redemption cap on agency debt and agency mortgage‑backed securities at $35 billion and will reinvest any principal payments in excess of this cap into Treasury securities. The Committee is strongly committed to returning inflation to its 2 percent objective.
In assessing the appropriate stance of monetary policy, the Committee will continue to monitor the implications of incoming information for the economic outlook. The Committee would be prepared to adjust the stance of monetary policy as appropriate if risks emerge that could impede the attainment of the Committee's goals. The Committee's assessments will take into account a wide range of information, including readings on labor market conditions, inflation pressures and inflation expectations, and financial and international developments.
Voting for the monetary policy action were Jerome H. Powell, Chair; John C. Williams, Vice Chair; Thomas I. Barkin; Michael S. Barr; Raphael W. Bostic; Michelle W. Bowman; Lisa D. Cook; Mary C. Daly; Philip N. Jefferson; Adriana D. Kugler; Loretta J. Mester; and Christopher J. Waller.
emphasis added


