by Calculated Risk on 4/07/2024 08:21:00 AM
Sunday, April 07, 2024
AAR: Rail Carloads Down YoY in March, Intermodal Up
From the Association of American Railroads (AAR) Rail Time Indicators. Graphs and excerpts reprinted with permission.
Total originated carloads on U.S. railroads fell 3.5% (31,101 carloads) in March 2024 from March 2023, their third straight monthly decline. Total carloads averaged 216,716 per week in March 2024, the fewest for any March in our records that begin in January 1988. In the first quarter of 2024, total carloads were down 4.2%, or 122,088 carloads, from the same period in 2023.
The problem is coal. ...
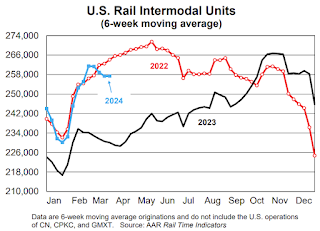
U.S. railroads also originated 1.02 million intermodal containers and trailers in March, up 11.7% (106,903 units) over March 2023 and their seventh consecutive year-over-year gain.
emphasis added
 Click on graph for larger image.
This graph from the Rail Time Indicators report shows the six-week average of U.S. Carloads in 2022, 2023 and 2024:
In March, total originated U.S. carloads fell 3.5% (31,101 carloads) from March 2023. They averaged 216,716 per week in March 2024, the fewest for any March in our records that begin in January 1988. Total carloads were down 4.2%, or 122,088 carloads, for the year to date.
 The second graph shows the six-week average (not monthly) of U.S. intermodal in 2022, 2023 and 2024: (using intermodal or shipping containers):
U.S. railroads originated 1.02 million intermodal containers and trailers in March, up 11.7% (106,903 units) over March 2023. It’s their seventh straight year-over-year gain. ... U.S. intermodal volume in Q1 2024 was 3.27 million units, virtually the same as the average for the first quarters from 2014 to 2023 (3.28 million).


