 RSS Feed
 by Calculated Risk on 3/21/2024 10:00:00 AM
Thursday, March 21, 2024
NAR: Existing-Home Sales Increased to 4.38 million SAAR in February
From the NAR: Existing-Home Sales Vaulted 9.5% in February, Largest Monthly Increase in a Year
Existing-home sales climbed in February, according to the National Association of REALTORS®. Among the four major U.S. regions, sales jumped in the West, South and Midwest, and were unchanged in the Northeast. Year-over-year, sales declined in all regions.
Total existing-home sales– completed transactions that include single-family homes, townhomes, condominiums and co-ops – bounced 9.5% from January to a seasonally adjusted annual rate of 4.38 million in February. Year-over-year, sales slid 3.3% (down from 4.53 million in February 2023).
...
Total housing inventory registered at the end of February was 1.07 million units, up 5.9% from January and 10.3% from one year ago (970,000). Unsold inventory sits at a 2.9-month supply at the current sales pace, down from 3.0 months in January but up from 2.6 months in February 2023.
emphasis added
 Click on graph for larger image.
This graph shows existing home sales, on a Seasonally Adjusted Annual Rate (SAAR) basis since 1994.
Sales in February (4.38 million SAAR) were up 9.5% from the previous month and were 3.3% below the February 2023 sales rate.
The second graph shows nationwide inventory for existing homes.
 According to the NAR, inventory increased to 1.07 million in February from 1.01 million the previous month.
 According to the NAR, inventory increased to 1.07 million in February from 1.01 million the previous month.
Headline inventory is not seasonally adjusted, and inventory usually decreases to the seasonal lows in December and January, and peaks in mid-to-late summer.
The last graph shows the year-over-year (YoY) change in reported existing home inventory and months-of-supply. Since inventory is not seasonally adjusted, it really helps to look at the YoY change. Note: Months-of-supply is based on the seasonally adjusted sales and not seasonally adjusted inventory.
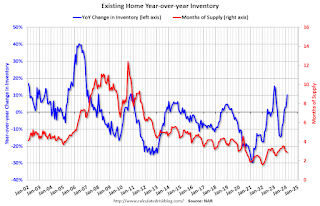 Inventory was up 10.3% year-over-year (blue) in February compared to February 2023.
Months of supply (red) decreased to 2.9 months in February from 3.0 months the previous month.
This was above the consensus forecast (but at Tom Lawler's estimate). I'll have more later.
The last graph shows the year-over-year (YoY) change in reported existing home inventory and months-of-supply. Since inventory is not seasonally adjusted, it really helps to look at the YoY change. Note: Months-of-supply is based on the seasonally adjusted sales and not seasonally adjusted inventory.
 Inventory was up 10.3% year-over-year (blue) in February compared to February 2023.
 Months of supply (red) decreased to 2.9 months in February from 3.0 months the previous month.
This was above the consensus forecast (but at Tom Lawler's estimate). I'll have more later.


