 RSS Feed
 by Calculated Risk on 8/21/2023 08:21:00 AM
Monday, August 21, 2023
Housing August 21st Weekly Update: Inventory increased 0.9% Week-over-week; Down 10.0% Year-over-year
Altos reports that active single-family inventory was up 0.9% week-over-week.
 Click on graph for larger image.
This inventory graph is courtesy of Altos Research.
As of August 18th, inventory was at 497 thousand (7-day average), compared to 492 thousand the prior week.
Year-to-date, inventory is up 1.2%. And inventory is up 22.5% from the seasonal bottom 18 weeks ago.
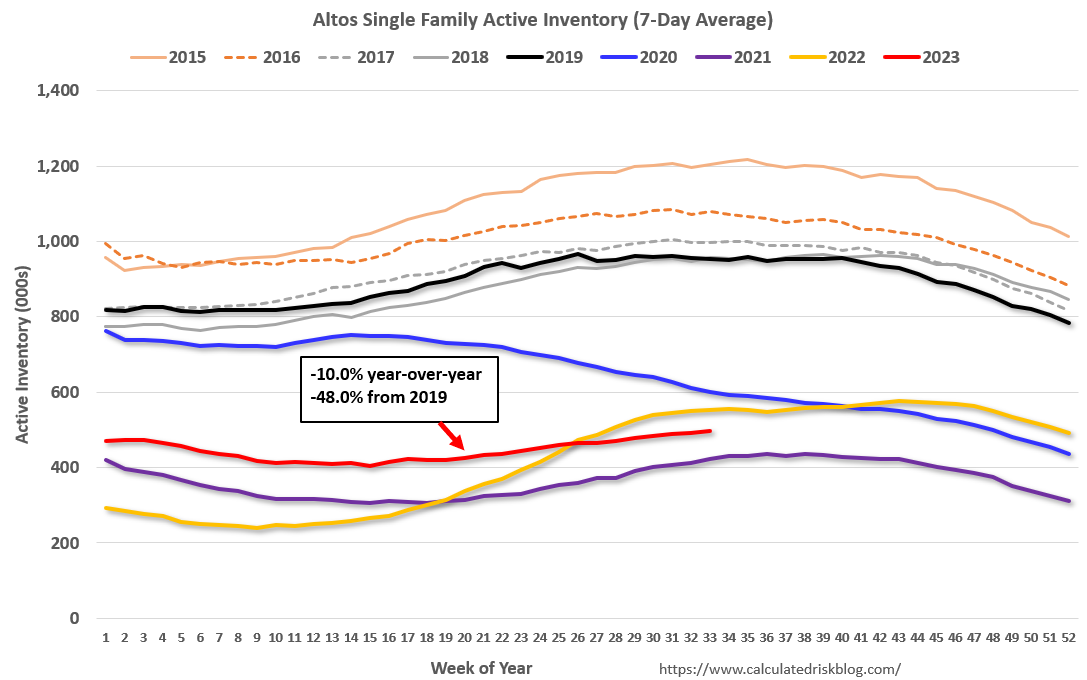
The red line is for 2023. The black line is for 2019. Note that inventory is up from the record low for the same week in 2021, but below last year and still well below normal levels.
Inventory was down 10.0% compared to the same week in 2022 (last week it was down 10.5%), and down 48.0% compared to the same week in 2019 (last week down 48.5%).
It appears same week inventory will be below 2022 levels for the remainder of the year. It is possible that inventory will fall below the record lows in 2021 and early 2022 later this year or in early 2024, but currently that seems unlikely.
Mike Simonsen discusses this data regularly on Youtube.


