 RSS Feed
 by Calculated Risk on 8/04/2023 01:05:00 PM
Friday, August 04, 2023
AAR: July Rail Carloads and Intermodal Decreased Year-over-year
From the Association of American Railroads (AAR) Rail Time Indicators. Graphs and excerpts reprinted with permission.
The July 4th holiday complicates an analysis of U.S. rail volumes in July, but there were some encouraging signs.
For example, the three non-July 4 weeks in July were the three highest-volume intermodal weeks of the year for U.S. railroads. Intermodal in July 2023 was still down 5.5% from July 2022, but that’s the smallest percentage decline for any month so far this year.
emphasis added
 Click on graph for larger image.
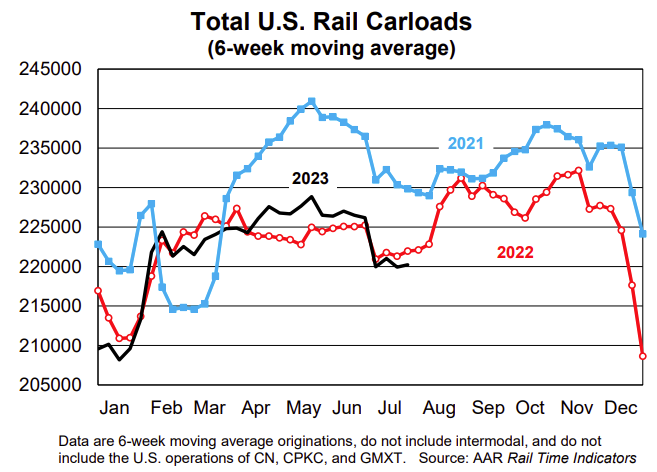
This graph from the Rail Time Indicators report shows the six-week average of U.S. Carloads in 2021, 2022 and 2022:
U.S. railroads originated 875,660 total carloads in July 2023, down 0.6% from July 2022 and their second straight small decline. Carloads averaged 218,915 per week in July 2023, the fewest for any month so far in 2023. July 4th is a big reason for that — the week of July 4th is always one of the lowest-volume weeks of the year. .
 The second graph shows the six-week average (not monthly) of U.S. intermodal in 2021, 2022 and 2023: (using intermodal or shipping containers):
U.S. intermodal volume averaged 241,888 containers and trailers per week in July 2023, down 5.5% from July 2022 and the 23rd decline in the past 24 months. July’s percentage decline was the smallest so far this year. The three non-July 4 weeks in July were the three highest-volume intermodal weeks of the year, which could be a hopeful sign for the future.


