 RSS Feed
 by Calculated Risk on 5/29/2023 12:06:00 PM
Monday, May 29, 2023
Recession Watch Update
Way back in 2013, I wrote a post "Predicting the Next Recession. In that 2013 post, I wrote:
The next recession will probably be caused by one of the following (from least likely to most likely):Unfortunately, in 2020, one of those low probability events happened (pandemic), and that led to a recession in 2020.
3) An exogenous event such as a pandemic, significant military conflict, disruption of energy supplies for any reason, a major natural disaster (meteor strike, super volcano, etc), and a number of other low probability reasons. All of these events are possible, but they are unpredictable, and the probabilities are low that they will happen in the next few years or even decades.
emphasis added
2) Significant policy error. Two examples: not reaching a fiscal agreement and going off the "fiscal cliff" probably would have led to a recession, and Congress refusing to "pay the bills" would have been a policy error that would have taken the economy into recession.That was written in 2013, and it appears once again that we've avoided the "default" policy error.
1) Most of the post-WWII recessions were caused by the Fed tightening monetary policy to slow inflation. I think this is the most likely cause of the next recession. Usually, when inflation starts to become a concern, the Fed tries to engineer a "soft landing", and frequently the result is a recession.And this most common cause of a recession is the current concern.
Talk of a recession increased last year. For example, from ECRI a year ago (May 26, 2022): Opinion: It’s time to prepare for a recession (ht SV). However, I wasn't even on recession watch!
A key mistake some analysts are making is ignoring distortions caused by the pandemic. See Pandemic Economics, Housing and Monetary Policy: Part I and Part II.
In December 2022 I went on "recession watch" for only the 3rd time in the 19 years that I've been writing this blog, but I noted I didn't see a recession coming yet. The other two times were in early 2007 (housing bust / financial crisis), and in March 2020 (pandemic).
The economic forecast prepared by the staff for the May FOMC meeting continued to assume that the effects of the expected further tightening in bank credit conditions, amid already tight financial conditions, would lead to a mild recession starting later this year, followed by a moderately paced recovery. Real GDP was projected to decelerate over the next two quarters before declining modestly in both the fourth quarter of this year and the first quarter of next year.And the FOMC members have been essentially projecting a recession for some time (although they avoid using the word "recession"). Here are their March projections for GDP and unemployment.
emphasis added
| GDP projections of Federal Reserve Governors and Reserve Bank presidents, Change in Real GDP1 | ||||
|---|---|---|---|---|
| Projection Date | 2023 | 2024 | 2025 | |
| Mar 2023 | 0.0 to 0.8 | 1.0 to 1.5 | 1.7 to 2.1 | |
Since Q1 real GDP growth was at 1.3% on a seasonally adjusted annual rate (SAAR) basis, and Q2 GDP is tracking 1% to 2%, the FOMC is essentially projecting GDP will decline over the last 2 quarters of 2023.
And on unemployment:
2 Projections for the unemployment rate are for the average civilian unemployment rate in the fourth quarter of the year indicated.
Since the unemployment rate was at 3.4% in April and depending on the growth of the civilian labor force in 2023, the FOMC is projecting between 800 thousand and 2 million jobs lost over the last two quarters of 2023. That is a clear employment recession.
| Unemployment projections of Federal Reserve Governors and Reserve Bank presidents, Unemployment Rate2 | ||||
|---|---|---|---|---|
| Projection Date | 2023 | 2024 | 2025 | |
| Mar 2023 | 4.0 to 4.7 | 4.3 to 4.9 | 4.3 to 4.8 | |
Since the unemployment rate was at 3.4% in April and depending on the growth of the civilian labor force in 2023, the FOMC is projecting between 800 thousand and 2 million jobs lost over the last two quarters of 2023. That is a clear employment recession.
Two key leading economic indicators are suggesting a recession this year.
 One of the leading indicators for recessions is the yield curve. Here is a graph of 10-Year Treasury Constant Maturity Minus 2-Year Treasury Constant Maturity from FRED.
Click here for interactive graph at FRED.
When the yield curve turns negative - the 2-year yields more than the 10-year - that suggests investors think interest rates will decline, usually indicating a coming recession. However, economist Campbell Harvey (yield curve inventor) noted last year:
My yield-curve indicator has gone Code Red. It is 8 for 8 in forecasting recessions since 1968 —with no false alarms. I have reasons to believe, however, that it is flashing a false signal.
...
The yield curve has now inverted for a ninth time since 1968. Does it spell doom? I am not so sure.
One of my favorite models for business cycle forecasting uses new home sales (also housing starts and residential investment). The purpose of the next graph is to show that these three indicators generally reach peaks and troughs together. Note that Residential Investment is quarterly and single-family starts and new home sales are monthly.
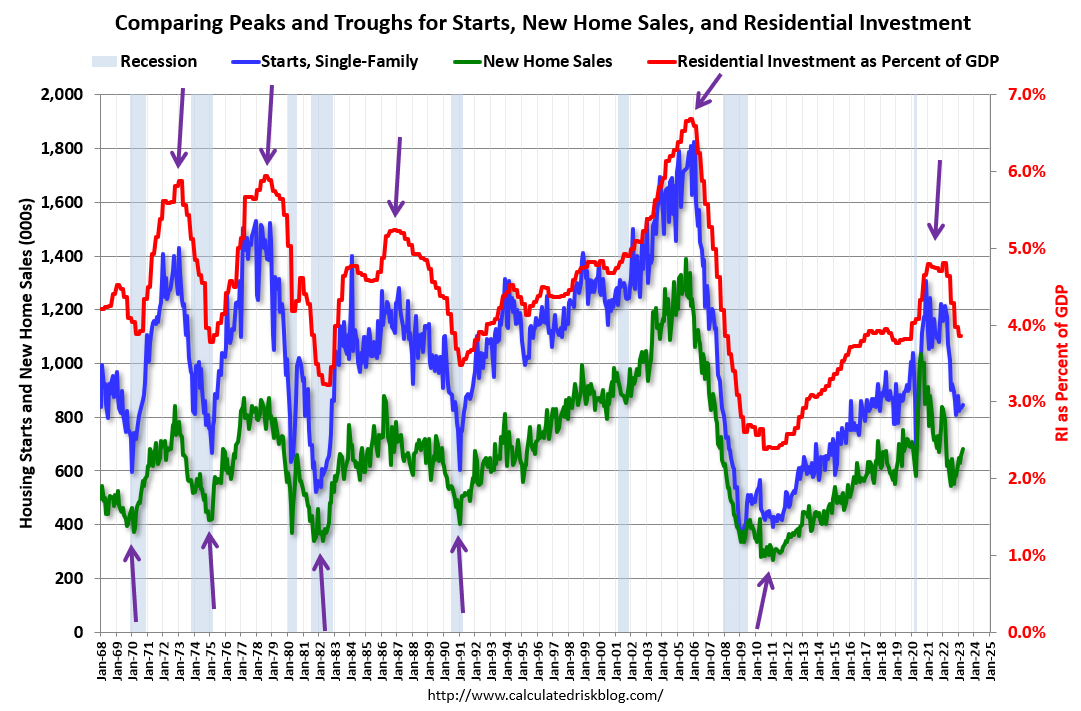 The arrows point to some of the earlier peaks and troughs for these three measures - and the most recent peak.
New home sales peaked in 2020 as pandemic buying soared. Then new home sales and single-family starts turned down in 2021, but that was partly due to the huge surge in sales during the pandemic. In 2022, both new home sales and single-family starts turned down in response to higher mortgage rates. Residential investment has also peaked.
This decline in residential investment would usually suggest a recession is coming.
 This third graph shows the YoY change in New Home Sales from the Census Bureau. Currently new home sales (based on 3-month average) are up 4% year-over-year!
Usually when the YoY change in New Home Sales falls about 20%, a recession will follow. An exception for this data series was the mid '60s when the Vietnam buildup kept the economy out of recession. Another exception was in late 2021 - we saw a significant YoY decline in new home sales related to the pandemic and the surge in new home sales in the second half of 2020. I ignored that downturn as a pandemic distortion (I am not a slave to any model). Also note that the sharp decline in 2010 was related to the housing tax credit policy in 2009 - and was just a continuation of the housing bust.
The YoY change in new home sales in late 2022 and early 2023 would usually suggest a possible recession. However, another feature of new home sales is that it usually leads the economy out of recession (an exception was following the housing bust, but I was able to correctly anticipate the recovery anyway).
Because of the low level of existing home inventory, new home sales are starting to pick up, and that suggests a possible recovery!

Another indicator I like to use is heavy truck sales. This graph shows heavy truck sales since 1967 using data from the BEA. The dashed line is the April 2023 seasonally adjusted annual sales rate (SAAR). Note: "Heavy trucks - trucks more than 14,000 pounds gross vehicle weight."
Heavy truck sales were at 563 thousand SAAR in April, up from 486 thousand in March, and up 23% from 456 thousand SAAR in April 2022.
Usually, heavy truck sales decline sharply prior to a recession, however sales were strong in April.
 A short term leading indicator I'll be watching is the 4-week average of unemployment claims.
This has increased recently and if this increases further, we might be entering an employment recession.
The FOMC is in a tough situation. The primary transmission mechanisms for Fed policy are usually housing followed by vehicle sales (a distant second). This time vehicle sales were more suppressed by supply chain issues (a pandemic distortion) and have increased recently, and it appears new home sales might have bottomed!
Fed policy is currently restrictive, and keeping policy at this level will likely bring inflation back to the target of 2%. Further rate increases would likely be a policy error and increase the odds of a recession. The current target range for the federal funds rate is 5 to 5-1/4 percent, well above r* + target inflation. Note: r* is an estimate of the real rate of interest.
My sense is growth will stay sluggish in 2023, but the economy will avoid recession. Monetary policy is restrictive, the fiscal policy will be a slight drag if the recent agreement passes the House and Senate. Vehicle sales will probably increase this year, but new home sales will stay low - but increase year-over-year for the remainder of 2023.
There is downside risk if the FOMC overtightens, or Congress forces a debt default (although this seems less likely now). Since two of the best leading indicators are suggesting a recession, I'll stay on recession watch, and I might change my view on a recession in a few months.


