 RSS Feed
 by Calculated Risk on 5/30/2023 02:41:00 PM
Tuesday, May 30, 2023
A few comments on the Seasonal Pattern for House Prices
Two key points:
1) There is a clear seasonal pattern for house prices.
2) The surge in distressed sales during the housing bust distorted the seasonal pattern.
For in depth description of these issues, see Jed Kolko's article from 2014 "Let’s Improve, Not Ignore, Seasonal Adjustment of Housing Data"
Note: I was one of several people to question the change in the seasonal factor (here is a post in 2009) - and this led to S&P Case-Shiller questioning the seasonal factor too (from April 2010). I still use the seasonal factor (I think it is better than using the NSA data).
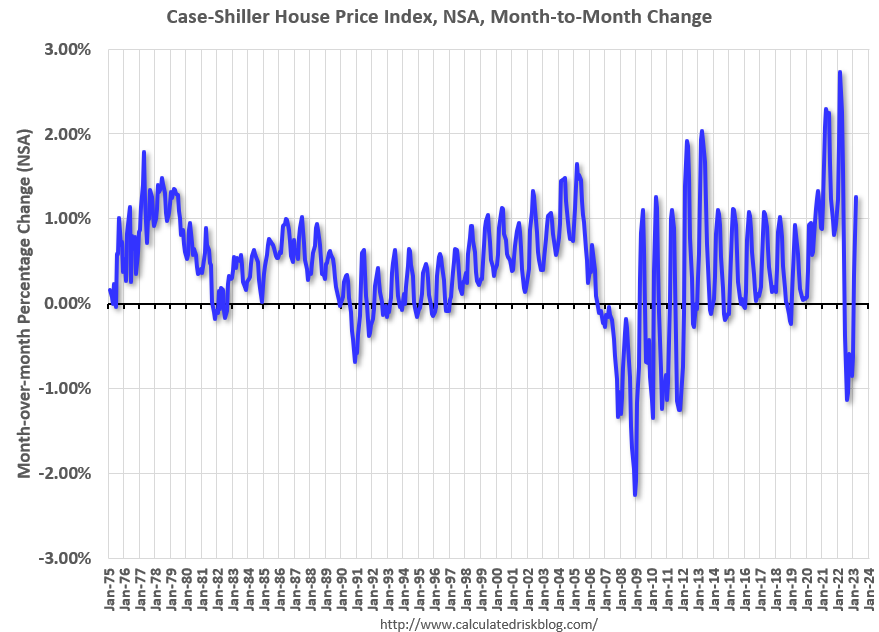 Click on graph for larger image.
This graph shows the month-to-month change in the NSA Case-Shiller National index since 1987 (through March 2023). The seasonal pattern was smaller back in the '90s and early '00s and increased once the bubble burst.
The seasonal swings declined following the bust, however the price surge changed the month-over-month pattern.
 The second graph shows the seasonal factors for the Case-Shiller National index since 1987. The factors started to change near the peak of the bubble, and really increased during the bust since normal sales followed the regular seasonal pattern - and distressed sales happened all year.
The swings in the seasonal factors have decreased, and the seasonal factors had been moving back towards more normal levels.
Note that the recent price surge - and slowdown - has only increased the swing in seasonal factors a little. Unless there is a wave of distressed sales (unlikely due to mostly solid lending), the seasonal pattern won't be distorted like during the housing bust.


