by Calculated Risk on 2/28/2023 03:00:00 PM
Tuesday, February 28, 2023
Las Vegas January 2023: Visitor Traffic Down 4.0% Compared to 2019; Convention Traffic Down 24.9%
Note: I like using Las Vegas as a measure of recovery for both leisure (visitors) and business (conventions).
From the Las Vegas Visitor Authority: January 2023 Las Vegas Visitor Statistics
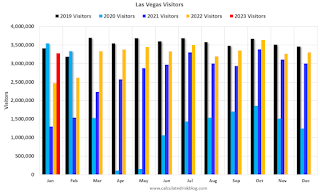
With strong weekends and rebounding attendance for conventions including the citywide tradeshows of CES, World of Concrete, and the SHOT show, Las Vegas hosted an estimated 3,275,000 visitors in January, well ahead of the lingering pandemic-suppressed volumes of January 2022 and just -4% shy of January 2019.
Overall hotel occupancy reached 79.1% for the month, +19.8 pts YoY and down -4.9 pts vs. 2019. Weekend occupancy reached 88.4%, nearly matching January 2019 levels (88.8%, -0.4 pts) while Midweek occupancy reached 75.2%, +23.2 pts vs. January 2022 but -6.9 pts vs. January 2019.
The ongoing trend of strong room rates continued in January as ADR approached $192, +32% YoY and +22.4% ahead of January 2019 while RevPAR exceeded $151, +76% YoY and +15.3% over 2019.
 Click on graph for larger image.
 The first graph shows visitor traffic for 2019 (Black), 2020 (light blue), 2021 (purple), 2022 (orange), and 2023 (red).
Visitor traffic was down 4.0% compared to the same month in 2019.
Note: There was almost no convention traffic from April 2020 through May 2021.


