 RSS Feed
 by Calculated Risk on 2/03/2023 09:44:00 AM
Friday, February 03, 2023
Comments on January Employment Report
This was a strong report, and the revisions show job growth was stronger over the last year than originally reported. With revisions: The 4.81 million jobs added, 2022 was the 2nd best year for job growth in US history behind only 2021 with 7.27 million.
The headline jobs number in the January employment report was well above expectations, and employment for the previous two months was revised up by 71,000, combined. The participation rate increased, and the unemployment rate decreased to 3.4% - the lowest rate since May 1969 (over 50 years ago!)
Leisure and hospitality gained 128 thousand jobs in January. At the beginning of the pandemic, in March and April of 2020, leisure and hospitality lost 8.2 million jobs, and are now down 495 thousand jobs since February 2020. So, leisure and hospitality has now added back about 94% all of the jobs lost in March and April 2020.
Construction employment increased 25 thousand and is now 276 thousand above the pre-pandemic level.
Manufacturing added 19 thousand jobs and is now 214 thousand above the pre-pandemic level.
In January, the year-over-year employment change was 4.97 million jobs.
Prime (25 to 54 Years Old) Participation
 Since the overall participation rate is impacted by both cyclical (recession) and demographic (aging population, younger people staying in school) reasons, here is the employment-population ratio for the key working age group: 25 to 54 years old.
The 25 to 54 participation rate increased in January to 82.7% from 82.4% in December, and the 25 to 54 employment population ratio increased to 80.2% from 80.1% the previous month.
Both are close to the pre-pandemic levels and indicate almost all of the prime age workers have returned to the labor force.
Average Hourly Wages
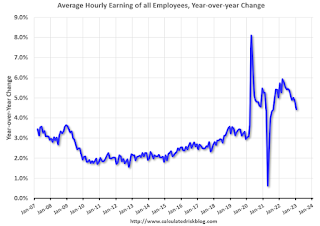 The graph shows the nominal year-over-year change in "Average Hourly Earnings" for all private employees from the Current Employment Statistics (CES).
Average Hourly Wages
 The graph shows the nominal year-over-year change in "Average Hourly Earnings" for all private employees from the Current Employment Statistics (CES).
 There was a huge increase at the beginning of the pandemic as lower paid employees were let go, and then the pandemic related spike reversed a year later.
Wage growth has trended down after peaking at 5.9% YoY in March 2022 and was at 4.4% YoY in January, down from 4.6% in December.
Part Time for Economic Reasons
 From the BLS report:
These workers are included in the alternate measure of labor underutilization (U-6) that increased to 6.6% from 6.5% in the previous month. This is down from the record high in April 22.9% and last month was the lowest level on record (seasonally adjusted) (series started in 1994). This measure is below the level in February 2020 (pre-pandemic).
Unemployed over 26 Weeks
 This graph shows the number of workers unemployed for 27 weeks or more.
According to the BLS, there are 1.111 million workers who have been unemployed for more than 26 weeks and still want a job, up from 1.069 million the previous month.
This is at pre-pandemic levels.
Summary:
The headline monthly jobs number was well above expectations and employment for the previous two months was revised up by 71,000, combined. The annual benchmark revision indicated job growth was significantly stronger than originally reported.
Wage growth has trended down after peaking at 5.9% YoY in March 2022 and was at 4.4% YoY in January, down from 4.6% in December.
Part Time for Economic Reasons
 From the BLS report:
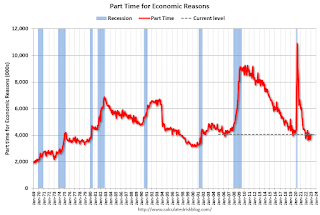
"The number of persons employed part time for economic reasons, at 4.1 million, was little changed in January. These individuals, who would have preferred full-time employment, were working part time because their hours had been reduced or they were unable to find full-time jobs."The number of persons working part time for economic reasons increased in January to 4.050 million from 3.878 million in December. This is at pre-recession levels.
These workers are included in the alternate measure of labor underutilization (U-6) that increased to 6.6% from 6.5% in the previous month. This is down from the record high in April 22.9% and last month was the lowest level on record (seasonally adjusted) (series started in 1994). This measure is below the level in February 2020 (pre-pandemic).
Unemployed over 26 Weeks
 This graph shows the number of workers unemployed for 27 weeks or more.
 According to the BLS, there are 1.111 million workers who have been unemployed for more than 26 weeks and still want a job, up from 1.069 million the previous month.
This is at pre-pandemic levels.
Summary:
The headline monthly jobs number was well above expectations and employment for the previous two months was revised up by 71,000, combined. The annual benchmark revision indicated job growth was significantly stronger than originally reported.
The headline unemployment rate decreased to 3.4%, the lowest rate since 1969.
Overall, this was a strong employment report.


