 RSS Feed
 by Calculated Risk on 11/06/2022 09:54:00 AM
Sunday, November 06, 2022
Solid Holiday Retail Sales Forecasts
Here are two holiday retail sales forecasts. One from the National Retail Federation (NRF), and another based on October seasonal retail hiring as described in Retail: October Seasonal Hiring vs. Holiday Retail Sales
First from the NRF: NRF Predicts Healthy Holiday Sales as Consumers Navigate Economic Headwinds
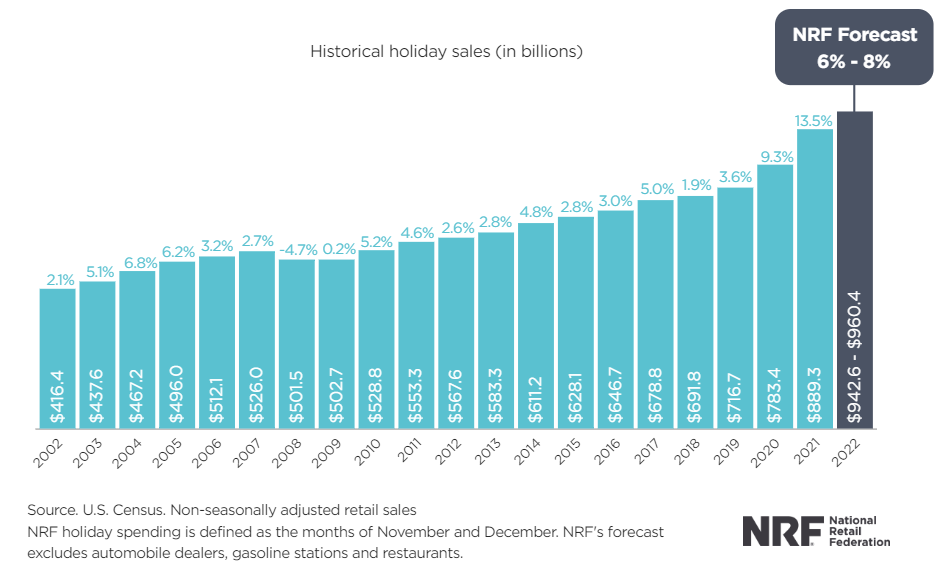
Holiday spending is expected to be healthy even with recent inflationary challenges, as the National Retail Federation today forecast that holiday retail sales during November and December will grow between 6% and 8% over 2021 to between $942.6 billion and $960.4 billion. Last year’s holiday sales grew 13.5% over 2020 and totaled $889.3 billion, shattering previous records. Holiday retail sales have averaged an increase of 4.9% over the past 10 years, with pandemic spending in recent years accounting for considerable gains.
emphasis added
 Click on graph for larger image.
Here is a graph from the NRF showing the year-over-year change in retail sales in November and December (ex-automobile dealers, gasoline stations and restaurants). This is NOT seasonally adjusted, and just for November and December.
My approach below uses real retail sales for Q4 (October, November and December) adjusted with CPI.
Using real retail sales: Every year I track seasonal retail hiring for hints about holiday retail sales. This is a "watch what they do, not what they say" approach! Here is a graph of retail hiring based on the October BLS employment report:
 This graph shows the historical net retail jobs added for October, November and December by year.
Retailers hired 163 thousand workers Not Seasonally Adjusted (NSA) net in October. This was down from the previous two years and suggests lower increase in real retail sales this holiday season than the previous two years -but still solid.
Note that in the early '90s, retailers started hiring seasonal workers earlier - and the trend towards hiring earlier has continued.
The following scatter graph is for the years 2005 through 2021 and compares October retail hiring with the real increase (inflation adjusted) for retail sales (Q4 over previous Q4).
 In general October hiring is a pretty good indicator of seasonal sales. R-square is 0.82 for this small sample. Note: This uses retail sales in Q4, and excludes autos, gasoline and restaurants.
The vertical dashed line is the forecast with 163 thousand seasonal hires in October 2022. October seasonal hiring suggests real retail sales will increase around 2.75% Q4/Q4 in 2022.
NOTE: The dot in the upper right - with real Retail sales up almost 10% YoY is for 2020 - when retail sales soared due to the pandemic spending on goods (service spending was soft).
NOTE: The dot in the upper right - with real Retail sales up almost 10% YoY is for 2020 - when retail sales soared due to the pandemic spending on goods (service spending was soft).
The NRF graph shows retail sales increasing more in 2021 than in 2020, but those are nominal sales (Not seasonally adjusted). In 2020, CPI increased 1.2% Q4-over-Q4 whereas CPI increased 6.7% Q4-over-Q4 in 2021. So real sales (inflation adjusted) increased the most in 2020, whereas nominal sales increased the most in 2021.
The NRF is forecasting nominal sales and retail seasonal hiring fits best with real retail sales.


