 RSS Feed
 by Calculated Risk on 9/29/2022 09:34:00 AM
Thursday, September 29, 2022
Inflation Adjusted House Prices Declined Further in July
Today, in the Calculated Risk Real Estate Newsletter: Inflation Adjusted House Prices Declined Further in July
Excerpt:
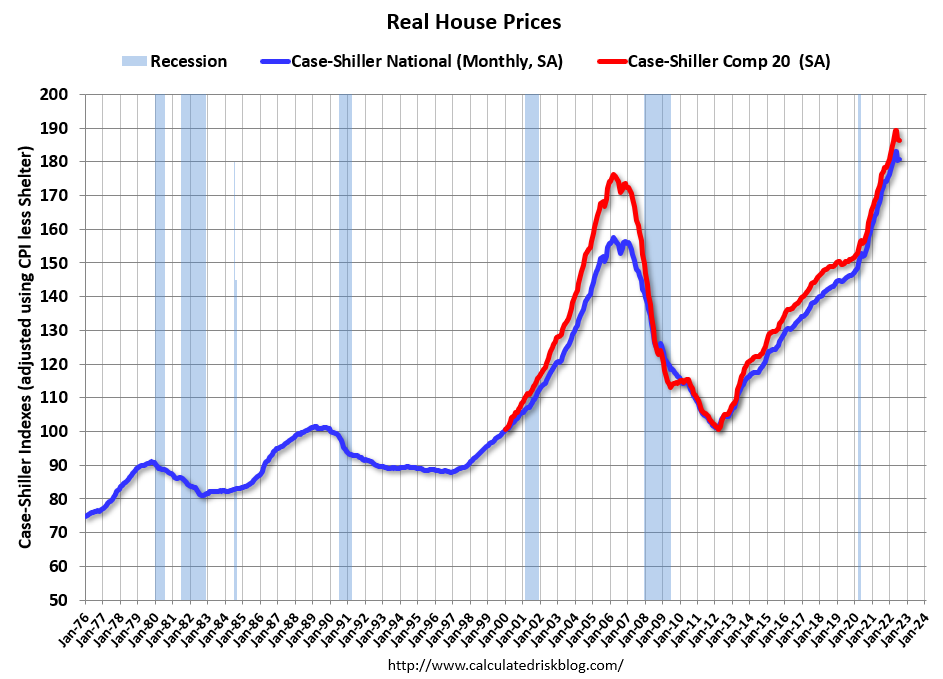
It has been over 16 years since the bubble peak. In the Case-Shiller release Tuesday, the seasonally adjusted National Index (SA), was reported as being 65% above the bubble peak in 2006. However, in real terms, the National index (SA) is about 15% above the bubble peak (and historically there has been an upward slope to real house prices). The composite 20, in real terms, is about 6% above the bubble peak.
People usually graph nominal house prices, but it is also important to look at prices in real terms (inflation adjusted). As an example, if a house price was $200,000 in January 2000, the price would be almost $338,000 today adjusted for inflation (69% increase). That is why the second graph below is important - this shows "real" prices (adjusted for inflation). ...
The second graph shows the same two indexes in real terms (adjusted for inflation using CPI less Shelter). Note: some people use other inflation measures to adjust for real prices. In real terms, the National index is 14.6% above the bubble peak, and the Composite 20 index is 5.6% above the bubble peak in early 2006.
This is the second consecutive month with declining real prices.
There is much more in the article. You can subscribe at https://calculatedrisk.substack.com/


