 RSS Feed
 by Calculated Risk on 5/06/2022 09:11:00 AM
Friday, May 06, 2022
Comments on April Employment Report
This was another solid report.
The headline jobs number in the April employment report was slightly above expectations, however employment for the previous two months was revised down by 39,000. The participation rate and the employment-population ratio both decreased slightly, and the unemployment rate was unchanged at 3.6%.
Excluding leisure and hospitality, the economy has added back all the jobs lost at the beginning of the pandemic. Leisure and hospitality gained 78 thousand jobs in April. At the beginning of the pandemic, in March and April of 2020, leisure and hospitality lost 8.20 million jobs, and are now down 1.44 million jobs since February 2020. So, leisure and hospitality has now added back about 83% all of the jobs lost in March and April 2020.
Construction employment increased 2 thousand and is now 4 thousand above the pre-pandemic level.
Manufacturing added 55 thousand jobs and is still 56 thousand below the pre-pandemic level.
Earlier: April Employment Report: 428 thousand Jobs, 3.6% Unemployment Rate
In April, the year-over-year employment change was 6.6 million jobs.
Permanent Job Losers
 Click on graph for larger image.
This graph shows permanent job losers as a percent of the pre-recession peak in employment through the report today.
In April, the year-over-year employment change was 6.6 million jobs.
Permanent Job Losers
 Click on graph for larger image.
This graph shows permanent job losers as a percent of the pre-recession peak in employment through the report today.
This data is only available back to 1994, so there is only data for three recessions.
In April, the number of permanent job losers decreased to 1.386 million from 1.392 million in the previous month.
In April, the number of permanent job losers decreased to 1.386 million from 1.392 million in the previous month.
These jobs were likely the hardest to recover, so it is a positive that the number of permanent job losers is almost back to pre-recession levels.
Prime (25 to 54 Years Old) Participation
 Since the overall participation rate has declined due to cyclical (recession) and demographic (aging population, younger people staying in school) reasons, here is the employment-population ratio for the key working age group: 25 to 54 years old.
The 25 to 54 participation rate decreased in April to 82.4% from 82.5% in March, and the 25 to 54 employment population ratio decreased to 79.9% from 80.0% the previous month.
Both are slightly below the pre-pandemic levels and indicate almost all of the prime age workers have returned to the labor force.
Part Time for Economic Reasons
 From the BLS report:
These workers are included in the alternate measure of labor underutilization (U-6) that increased to 7.0% from 6.9% in the previous month. This is down from the record high in April 22.9% for this measure since 1994. This measure at the 7.0% in February 2020 (pre-pandemic).
Unemployed over 26 Weeks
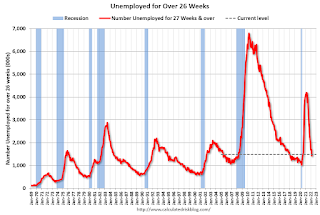 This graph shows the number of workers unemployed for 27 weeks or more.
According to the BLS, there are 1.483 million workers who have been unemployed for more than 26 weeks and still want a job, up from 1.428 million the previous month.
This does not include all the people that left the labor force.
Summary:
The headline monthly jobs number was slightly above expectations; however, the previous two months were revised down by 39,000 combined.
Part Time for Economic Reasons
 From the BLS report:
"The number of persons employed part time for economic reasons was little changed at 4.0 million in April and is down by 357,000 from its February 2020 level. These individuals, who would have preferred full-time employment, were working part time because their hours had been reduced or they were unable to find full-time jobs."The number of persons working part time for economic reasons decreased in April to 4.033 million from 4.170 million in March. This is below pre-recession levels.
These workers are included in the alternate measure of labor underutilization (U-6) that increased to 7.0% from 6.9% in the previous month. This is down from the record high in April 22.9% for this measure since 1994. This measure at the 7.0% in February 2020 (pre-pandemic).
Unemployed over 26 Weeks
 This graph shows the number of workers unemployed for 27 weeks or more.
 According to the BLS, there are 1.483 million workers who have been unemployed for more than 26 weeks and still want a job, up from 1.428 million the previous month.
This does not include all the people that left the labor force.
Summary:
The headline monthly jobs number was slightly above expectations; however, the previous two months were revised down by 39,000 combined.
The headline unemployment rate was unchanged at 3.6%.
There are still 1.2 million fewer jobs than prior to the recession.
Overall, this was another solid report.


