 RSS Feed
 by Calculated Risk on 1/25/2022 09:15:00 AM
Tuesday, January 25, 2022
Case-Shiller: National House Price Index increased 18.8% year-over-year in November
S&P/Case-Shiller released the monthly Home Price Indices for November ("November" is a 3-month average of September, October and November prices).
This release includes prices for 20 individual cities, two composite indices (for 10 cities and 20 cities) and the monthly National index.
From S&P: S&P Corelogic Case-Shiller Index Reports 18.8% Annual Home Price Gain in November
The S&P CoreLogic Case-Shiller U.S. National Home Price NSA Index, covering all nine U.S. census divisions, reported an 18.8% annual gain in November, down from 19.0% in the previous month. The 10-City Composite annual increase came in at 16.8%, down from 17.2% in the previous month. The 20- City Composite posted an 18.3% year-over-year gain, down from 18.5% in the previous month.
Phoenix, Tampa, and Miami reported the highest year-over-year gains among the 20 cities in November. Phoenix led the way with a 32.2% year-over-year price increase, followed by Tampa with a 29.0% increase and Miami with a 26.6% increase. Eleven of the 20 cities reported higher price increases in the year ending November 2021 versus the year ending October 2021.
...
Before seasonal adjustment, the U.S. National Index posted a 0.9% month-over-month increase in November, while the 10-City and 20-City Composites posted increases of 0.9% and 1.0%, respectively.
After seasonal adjustment, the U.S. National Index posted a month-over-month increase of 1.1%, and the 10-City and 20-City Composites posted increases of 1.1% and 1.2%, respectively.
In November, 19 of the 20 cities reported increases before seasonal adjustments while all 20 cities reported increases after seasonal adjustments.
“For the past several months, home prices have been rising at a very high, but decelerating, rate. That trend continued in November 2021,” says Craig J. Lazzara, Managing Director at S&P DJI. “The National Composite Index rose 18.8% from year-ago levels, and the 10- and 20-City Composites gained 16.8% and 18.3%, respectively. In all three cases, November’s gains were less than October’s. Despite this deceleration, it’s important to remember that November’s 18.8% gain was the sixth-highest reading in the 34 years covered by our data (the top five were the months immediately preceding November).
emphasis added
 Click on graph for larger image.
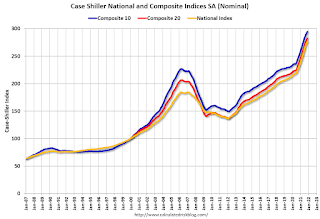
 The first graph shows the nominal seasonally adjusted Composite 10, Composite 20 and National indices (the Composite 20 was started in January 2000).
The Composite 10 index is up 1.1% in November (SA).
The Composite 20 index is up 1.2% (SA) in November.
The National index is 50% above the bubble peak (SA), and up 1.1% (SA) in November. The National index is up 102% from the post-bubble low set in February 2012 (SA).
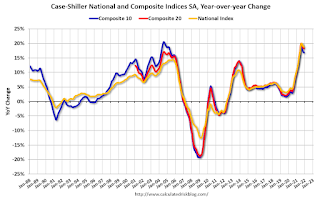 The second graph shows the year-over-year change in all three indices.
The Composite 10 SA is up 16.8% year-over-year. The Composite 20 SA is up 18.3% year-over-year.
The National index SA is up 18.8% year-over-year.
Price increases were close to expectations. I'll have more later.


