by Calculated Risk on 12/06/2021 12:24:00 PM
Monday, December 06, 2021
Black Knight Mortgage Monitor for September: "More than 750K borrowers left forbearance plans over the past 45 days"
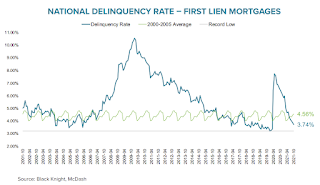
Black Knight released their Mortgage Monitor report for September today. According to Black Knight, 3.74% of mortgage were delinquent in September, down from 3.91% of mortgages in August, and down from 6.44% in September 2020. Black Knight also reported that 0.26% of mortgages were in the foreclosure process, down from 0.33% a year ago.
This gives a total of 4.07% delinquent or in foreclosure.
Press Release: Tappable Equity Surges $254 Billion in Q3 to All-Time High of $9.4 Trillion as Cash-Out Refinance Borrowers Pull Largest Quarterly Volume of Equity in 14 Years
Today, the Data & Analytics division of Black Knight, Inc. (NYSE:BKI) released its latest Mortgage Monitor Report, based upon the company’s industry-leading mortgage, real estate and public records datasets. Though the rate of home price appreciation has begun to slow in recent months, the explosive growth of the last few years has driven tappable equity – the amount available for a mortgage holder to access while retaining at least a 20% equity stake in their home – to one new height after another. According to Black Knight Data & Analytics President Ben Graboske, a nearly-quarter-trillion dollar increase in tappable equity over the third quarter has resulted in not only yet another record high, but also the lowest total market leverage on record.
“Home price growth in the third quarter – while less than half that of Q2’s history-making rate – added more than $250 billion to Americans’ already record levels of tappable equity,” said Graboske. “The aggregate total of $9.4 trillion is up an astonishing 32% from the same time last year and nearly 90% higher than the pre-Great Recession peak in 2006. As prices have surged over the past 18 months, the average mortgage-holder’s equity stake has risen by $53,000. That works out to nearly $178,000 available in tappable equity to the average homeowner with a mortgage before hitting a maximum combined loan-to-value ratio of 80%. What’s more, in the third quarter, homeowners tapped into their equity at the highest rate in more than 14 years as cash-outs made up 54% of all refinances.
...
This month’s Mortgage Monitor also examines the impact of rising prices and interest rates on home affordability, finding that the monthly mortgage payment (principal and interest) to purchase the average-priced home with 20% down has jumped by nearly 25% since the start of the year. Factoring in incomes as well as prices across the country, it now requires 22.4% of the median income to purchase the average-priced home with 20% down and a 30-year mortgage. This is the largest share of income required for a home purchase since late 2018, when interest rates were near 5%, but still far below the 34%+ payment-to-income ratio reached in 2006.
emphasis added
 Click on graph for larger image.
Here is a graph on delinquencies from Black Knight:
• The national delinquency rate, at 3.74%, is just over a half percentage point above the all-time low, set in January 2020
• Serious delinquencies fell by more than 10% (-127K) in October as the first wave of forbearance entrants returned to making mortgage payments
• Further improvement is expected in coming weeks as most borrowers exiting forbearance plans are still working through loss mitigation options with their lenders
• There are still nearly 700K more seriously delinquent mortgages (including those in active forbearance plans) than there were prior to the pandemic
 And on the current status of loans that have exited forbearance:
 • More than 750K borrowers left forbearance plans over the past 45 days, and while the dust continues to settle on their post-forbearance performance, early trends are like other recent exit monthsThere is much more in the mortgage monitor.
• Trends are also becoming clearer among earlier forbearance exits, with fewer than 15% of borrowers who left plans in May remaining either delinquent (8%) or in post-forbearance loss mitigation (5%), a share that falls below 10% among those exiting before the end of April
• Among borrowers who left plans from September through November, only 7% are no longer in loss mitigation and remain delinquent, but 38% of such exits – and as many as 53% of those who exited in early November – remain in loss mitigation, as servicers and borrowers work through available options
• Given the large volume of exit activity over the past 45 days, all eyes will be on the success rate of those loss mitigation efforts in coming weeks


