 RSS Feed
 by Calculated Risk on 11/23/2021 09:16:00 AM
Tuesday, November 23, 2021
Update: The Coming Deceleration in House Price Growth
Last month, in the Real Estate Newsletter, I wrote: The Coming Deceleration in House Price Growth
Here is an update to the graph:
Not only is Case-Shiller released with a lag (the release next week will be for September, whereas the NAR release yesterday was for October), but the 3-month average means the September release will include sales in July and August too.
Although median prices can be distorted by the mix, and repeat sales indexes (like Case-Shiller and the FHFA) are more accurate measures of house prices, the median price index might provide earlier hints on the direction of prices.
 Click on graph for larger image.
This graph - as of the NAR release in October 2020 (a year ago) - shows median prices started to take off, even though the most recent Case-Shiller report only showed a very modest pickup in prices.
This shows the lag in the Case-Shiller report.
The second graph - as of the NAR release yesterday - shows that Case-Shiller followed the median prices up, and that median prices are now falling.
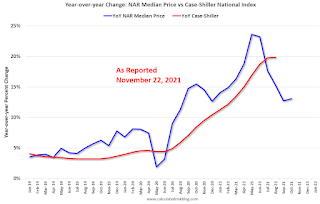 Note: the NAR YoY change in September 2021 was revised down, so there was a slight uptick in October prices YoY.
The second graph - as of the NAR release yesterday - shows that Case-Shiller followed the median prices up, and that median prices are now falling.
 Note: the NAR YoY change in September 2021 was revised down, so there was a slight uptick in October prices YoY.
This suggests that Case-Shiller will start to show some deceleration later this year - but still be up solidly YoY.


