by Calculated Risk on 12/03/2020 10:59:00 AM
Thursday, December 03, 2020
Hotels: Occupancy Rate Declined 28.5% Year-over-year
From HotelNewsNow.com: STR: US hotel results for week ending 28 November
U.S. weekly hotel occupancy fell to its lowest level since late May, according to the latest data from STR through 28 November.Since there is a seasonal pattern to the occupancy rate - see graph below - we can track the year-over-year change in occupancy to look for any improvement. This table shows the year-over-year change since the week ending Sept 19, 2020:
22-28 November 2020 (percentage change from comparable week in 2019):
• Occupancy: 36.2% (-28.5%)
• Average daily rate (ADR): US$92.49 (-17.8%)
• Revenue per available room (RevPAR): US$33.49 (-41.2%)
TSA checkpoint counts increased sharply with more than 6 million passengers during both the week before and of Thanksgiving. However, that increased air travel volume did not translate to more hotel rooms sold as weekly demand (13.2 million) and occupancy fell to their lowest levels since late May. This would indicate that a bulk of travelers opted to stay with family during the holiday. emphasis added
| Week Ending | YoY Change, Occupancy Rate |
|---|---|
| 9/19 | -31.9% |
| 9/26 | -31.5% |
| 10/3 | -29.6% |
| 10/10 | -29.2% |
| 10/17 | -30.7% |
| 10/24 | -31.7% |
| 10/31 | -29.0% |
| 11/7 | -35.9% |
| 11/14 | -32.7% |
| 11/21 | -32.6% |
| 11/28 | -28.5% |
This suggests little improvement over the last 11 weeks.
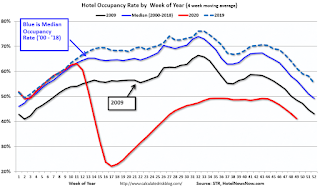
The following graph shows the seasonal pattern for the hotel occupancy rate using the four week average.
 Click on graph for larger image.
The red line is for 2020, dash light blue is 2019, blue is the median, and black is for 2009 (the worst year since the Great Depression for hotels - before 2020).
Seasonally we'd expect the occupancy rate to decline into the new year.
Note: Y-axis doesn't start at zero to better show the seasonal change.


