 RSS Feed
 by Calculated Risk on 12/04/2020 09:18:00 AM
Friday, December 04, 2020
Comments on November Employment Report
The headline jobs number in the November employment report was well below expectations, however employment for the previous two months were revised up slightly, combined.
Government employment declined 99 thousand in November. The job losses at the Federal level were due to letting go temporary decennial workers, however state and local governments lost jobs again. These state and local government job losses could increase sharply in early 2021 if there is no disaster relief for the states.
Leisure and hospitality added another 31 thousand jobs in November, following 4.84 million jobs added in May through October. Leisure and hospitality lost 8.3 million jobs in March and April, so about 59% of those jobs were added back in the May through November period.
Earlier: November Employment Report: 245 Thousand Jobs Added, 6.7% Unemployment Rate
In November, the year-over-year employment change was minus 9.19 million jobs.
Permanent Job Losers
 Click on graph for larger image.
This graph shows permanent job losers as a percent of the pre-recession peak in employment through the November report. (ht Joe Weisenthal at Bloomberg)
This data is only available back to 1994, so there is only data for three recessions.
In November, the number of permanent job losers increased to 3.743 million from 3.684 million in October.
Prime (25 to 54 Years Old) Participation
 Since the overall participation rate has declined due to cyclical (recession) and demographic (aging population, younger people staying in school) reasons, here is the employment-population ratio for the key working age group: 25 to 54 years old.
The prime working age will be key in the eventual recovery.
The 25 to 54 participation rate decreased in November to 80.9% from 81.2% in October, and the 25 to 54 employment population ratio was unchanged at 76.0% from 76.0% in October.
Seasonal Retail Hiring
Typically retail companies start hiring for the holiday season in October, and really increase hiring in November. Here is a graph that shows the historical net retail jobs added for October, November and December by year.
 This graph really shows the collapse in retail hiring in 2008. Since then seasonal hiring had increased back close to more normal levels. Note: I expect the long term trend will be down with more and more internet holiday shopping.
Retailers hired 302 thousand workers (NSA) net in November. Note: this is NSA (Not Seasonally Adjusted). This was a loss of 35 thousand jobs, seasonally adjusted, in November.
This might be distorted this year by a combination of seasonal hiring - and some bounce back in employment from the shutdowns earlier this year.
Part Time for Economic Reasons
 From the BLS report:
These workers are included in the alternate measure of labor underutilization (U-6) that decreased to 12.0% in November. This is down from the record high in April 22.8% for this measure since 1994.
Unemployed over 26 Weeks
 This graph shows the number of workers unemployed for 27 weeks or more.
According to the BLS, there are 3.941 million workers who have been unemployed for more than 26 weeks and still want a job.
This has increased sharply - since the largest number of layoffs were around April - and this will be a key measure to follow during the recovery.
Summary:
The headline monthly jobs number was well below expectations, however the previous two months were revised up 11,000 combined. The headline unemployment rate decreased to 6.7%, but this was due to a decline in the participation rate. Overall this was a disappointing report.
Leisure and hospitality added another 31 thousand jobs in November, following 4.84 million jobs added in May through October. Leisure and hospitality lost 8.3 million jobs in March and April, so about 59% of those jobs were added back in the May through November period.
Earlier: November Employment Report: 245 Thousand Jobs Added, 6.7% Unemployment Rate
In November, the year-over-year employment change was minus 9.19 million jobs.
Permanent Job Losers
 Click on graph for larger image.
This graph shows permanent job losers as a percent of the pre-recession peak in employment through the November report. (ht Joe Weisenthal at Bloomberg)
This data is only available back to 1994, so there is only data for three recessions.
In November, the number of permanent job losers increased to 3.743 million from 3.684 million in October.
Prime (25 to 54 Years Old) Participation
 Since the overall participation rate has declined due to cyclical (recession) and demographic (aging population, younger people staying in school) reasons, here is the employment-population ratio for the key working age group: 25 to 54 years old.
The prime working age will be key in the eventual recovery.
The 25 to 54 participation rate decreased in November to 80.9% from 81.2% in October, and the 25 to 54 employment population ratio was unchanged at 76.0% from 76.0% in October.
Seasonal Retail Hiring
Typically retail companies start hiring for the holiday season in October, and really increase hiring in November. Here is a graph that shows the historical net retail jobs added for October, November and December by year.
 This graph really shows the collapse in retail hiring in 2008. Since then seasonal hiring had increased back close to more normal levels. Note: I expect the long term trend will be down with more and more internet holiday shopping.
Retailers hired 302 thousand workers (NSA) net in November. Note: this is NSA (Not Seasonally Adjusted). This was a loss of 35 thousand jobs, seasonally adjusted, in November.
This might be distorted this year by a combination of seasonal hiring - and some bounce back in employment from the shutdowns earlier this year.
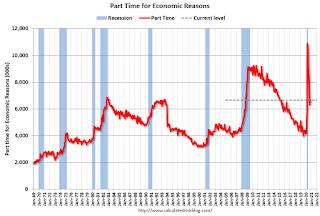
Part Time for Economic Reasons
 From the BLS report:
"The number of persons employed part time for economic reasons was about unchanged over the month at 6.7 million but remains 2.3 million higher than the February level. These individuals, who would have preferred full-time employment, were working part time because their hours had been reduced or they were unable to find full-time jobs."The number of persons working part time for economic reasons decreased slightly in November to 6.660 million from 6.684 million in October.
These workers are included in the alternate measure of labor underutilization (U-6) that decreased to 12.0% in November. This is down from the record high in April 22.8% for this measure since 1994.
Unemployed over 26 Weeks
 This graph shows the number of workers unemployed for 27 weeks or more.
 According to the BLS, there are 3.941 million workers who have been unemployed for more than 26 weeks and still want a job.
This has increased sharply - since the largest number of layoffs were around April - and this will be a key measure to follow during the recovery.
Summary:
The headline monthly jobs number was well below expectations, however the previous two months were revised up 11,000 combined. The headline unemployment rate decreased to 6.7%, but this was due to a decline in the participation rate. Overall this was a disappointing report.


