by Calculated Risk on 10/01/2019 08:37:00 AM
Tuesday, October 01, 2019
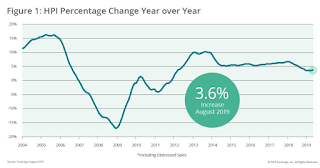
CoreLogic: House Prices up 3.6% Year-over-year in August
Notes: This CoreLogic House Price Index report is for August. The recent Case-Shiller index release was for July. The CoreLogic HPI is a three month weighted average and is not seasonally adjusted (NSA).
From CoreLogic: CoreLogic Reports August Home Prices Increased by 3.6% Year Over Year
CoreLogic® ... today released the CoreLogic Home Price Index (HPI™) and HPI Forecast™ for August 2019, which shows home prices rose both year over year and month over month. Home prices increased nationally by 3.6% from August 2018. On a month-over-month basis, prices increased by 0.4% in August 2019. (July 2019 data was revised. Revisions with public records data are standard, and to ensure accuracy, CoreLogic incorporates the newly released public data to provide updated results each month.)
Home prices continue to increase on an annual basis with the CoreLogic HPI Forecast indicating annual price growth will increase 5.8% by August 2020. On a month-over-month basis, the forecast calls for home prices to increase by 0.3% from August 2019 to September 2019. The CoreLogic HPI Forecast is a projection of home prices calculated using the CoreLogic HPI and other economic variables. Values are derived from state-level forecasts by weighting indices according to the number of owner-occupied households for each state.
“The 3.6% increase in annual home price growth this August marked a big slowdown from a year earlier when the U.S. index was up 5.5%,” said Dr. Frank Nothaft, chief economist at CoreLogic. “While the slowdown in appreciation occurred across the country at all price points, it was most pronounced at the lower end of the market. Prices for the lowest-priced homes increased by 5.5%, compared with August 2018, when prices increased by 8.4%. This moderation in home-price growth should be welcome news to entry-level buyers.”
emphasis added
 This graph is from CoreLogic and shows the YoY change in their index.
CR Note: The YoY change in the CoreLogic index decreased over the last year, but is now moving sideways.


