by Calculated Risk on 9/07/2018 04:59:00 PM
Friday, September 07, 2018
AAR: August Rail Carloads Up 3.8% YoY, Intermodal Up 5.1% YoY
From the Association of American Railroads (AAR) Rail Time Indicators. Graphs and excerpts reprinted with permission.
August 2018 was yet another good month for rail traffic. U.S. railroads originated 1.39 million carloads in August 2018, up 3.8% (50,335 carloads) over August 2017.
…
U.S. railroads also originated 1.44 million intermodal containers and trailers in August 2018, up 5.1%, or 70,198 units, over August 2017.
 Click on graph for larger image.
This graph from the Rail Time Indicators report shows U.S. average weekly rail carloads (NSA). Light blue is 2018.
Rail carloads have been weak over the last decade due to the decline in coal shipments.
U.S. railroads originated 1,386,026 carloads in August 2018, up 50,335 carloads, or 3.8%, over August 2017. August 2018 was the sixth straight year-over-year monthly increase for total carloads, Carloads averaged 277,205 per week in August 2018, the most for any month since October 2015. The 3.8% percentage gain in August 2018 was the biggest for any month since June 2017.
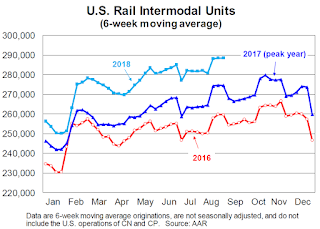
 The second graph is for intermodal traffic (using intermodal or shipping containers):
U.S. intermodal originations totaled 1,442,920 containers and trailers in August 2018, up 5.1%, or 70,198 units, over August 2017. Average weekly intermodal volume in August 2018 was 288,584 units, the second highest weekly average for any month in history (behind June 2018’s 289,993).2018 will be another record year for intermodal traffic.


