by Calculated Risk on 4/24/2018 09:14:00 AM
Tuesday, April 24, 2018
Case-Shiller: National House Price Index increased 6.3% year-over-year in February
S&P/Case-Shiller released the monthly Home Price Indices for February ("February" is a 3 month average of December, January and February prices).
This release includes prices for 20 individual cities, two composite indices (for 10 cities and 20 cities) and the monthly National index.
Note: Case-Shiller reports Not Seasonally Adjusted (NSA), I use the SA data for the graphs.
From S&P: S&P CoreLogic Case-Shiller Home Prices: Cities in the West Continue to Lead Housing Momentum
The S&P CoreLogic Case-Shiller U.S. National Home Price NSA Index, covering all nine U.S. census divisions, reported a 6.3% annual gain in February, up from 6.1% in the previous month. The 10-City Composite annual increase came in at 6.5%, up from 6.0% in the previous month. The 20-City Composite posted a 6.8% year-over-year gain, up from 6.4% in the previous month.
Seattle, Las Vegas, and San Francisco continue to report the highest year-over-year gains among the 20 cities. In February, Seattle led the way with a 12.7% year-over-year price increase, followed by Las Vegas with an 11.6% increase and San Francisco with a 10.1% increase. Thirteen of the 20 cities reported greater price increases in the year ending February 2018 versus the year ending January 2018.
...
Before seasonal adjustment, the National Index posted a month-over-month gain of 0.4% in February. The 10-City and 20-City Composites both reported increases of 0.7%. After seasonal adjustment, the National Index recorded a 0.5% month-over-month increase in February. The 10-City and 20-City Composites both posted 0.8% month-over-month increases. All 20 cities reported increases in February before and after seasonal adjustment.
“Home prices continue to rise across the country,” says David M. Blitzer, Managing Director and Chairman of the Index Committee at S&P Dow Jones Indices. “The S&P CoreLogic Case-Shiller National Index is up 6.3% in the 12 months through February 2018. Year-over-year prices measured by the National index have increased continuously for the past 70 months, since May 2012. Over that time, the price increases averaged 6% per year. This run, which is still ongoing, compares to the previous long run from January 1992 to February 2007, 182 months, when prices averaged 6.1% annually. With expectations for continued economic growth and further employment gains, the current run of rising prices is likely to continue.
“Increasing employment supports rising home prices both nationally and locally. Among the 20 cities covered by the S&P CoreLogic Case-Shiller Indices, Seattle enjoyed both the largest gain in employment and in home prices over the 12 months ended in February 2018. At the other end of the scale, Chicago was ranked 19th in both home price and employment gains; Cleveland ranked 18th in home prices and 20th in employment increases. In San Francisco and Los Angeles, home price gains ranked much higher than would be expected from their employment increases, indicating that California home prices continue to rise faster than might be expected. In contrast, Miami home prices experienced some of the smaller increases despite better than average employment gains.”
emphasis added
 Click on graph for larger image.
 The first graph shows the nominal seasonally adjusted Composite 10, Composite 20 and National indices (the Composite 20 was started in January 2000).
The Composite 10 index is off 1.6% from the peak, and up 0.7% in February (SA).
The Composite 20 index is 1.3% above the bubble peak, and up 0.8% (SA) in February.
The National index is 8.2% above the bubble peak (SA), and up 0.5% (SA) in February. The National index is up 46.3% from the post-bubble low set in December 2011 (SA).
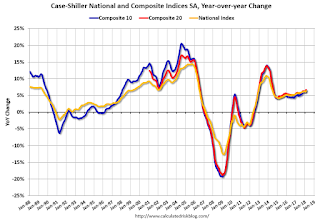
 The second graph shows the Year over year change in all three indices.
The Composite 10 SA is up 6.5% compared to February 2017. The Composite 20 SA is up 6.8% year-over-year.
The National index SA is up 6.3% year-over-year.
Note: According to the data, prices increased in all 20 of 20 cities month-over-month seasonally adjusted.
I'll have more later.


