by Calculated Risk on 2/09/2017 03:26:00 PM
Thursday, February 09, 2017
Prime Working-Age Population near 2007 Peak
The prime working age population peaked in 2007, and bottomed at the end of 2012. As of January 2017, there are still fewer people in the 25 to 54 age group than in 2007.
However the prime working age (25 to 54) will probably hit a new peak this year.
Changes in demographics are an important determinant of economic growth, and although most people focus on the aging of the "baby boomer" generation, the movement of younger cohorts into the prime working age is another key story. Here is a graph of the prime working age population (25 to 54 years old) - and prime plus (20 to 59 years old) from 1948 through January 2017.
Note: This is population, not work force.

There was a huge surge in the prime working age population in the '70s, '80s and '90s.
The prime working age labor force grew even quicker than the population in the '70s and '80s due to the increase in participation of women. In fact, the prime working age labor force was increasing 3%+ per year in the '80s!
So when we compare economic growth to the '70s, '80, or 90's we have to remember this difference in demographics (the '60s saw solid economic growth as near-prime age groups increased sharply).
The good news is the prime working age group has started to grow again, and is now growing at 0.5% per year - and this should boost economic activity. And it appears the prime working age group will exceed the previous peak this year.
If we look at the prime plus working age (20 to 59 age groups, the story is a little different. This prime plus group is still growing, but the growth will probably slow over the next few years as the younger boomers start retiring.

The cohorts with the next highest participation rates are 55 to 59 years old, and 20 to 24 years old. So these two groups are included in the first graph in the red line.
We could also add 60 to 64 too in the prime plus group (not included in first graph)

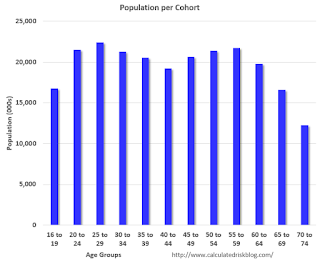
Note that 16 to 19 is only for four years; all other cohorts are five year groups.
The largest cohort is now in the 25 to 29 age group (this cohort is one reason I've been positive on rentals for the last 5+ years).
With these large cohorts moving into the prime working age - and the prime working age population growing again - this is a reason for optimism.


