 RSS Feed
 by Calculated Risk on 2/03/2017 08:49:00 AM
Friday, February 03, 2017
January Employment Report: 227,000 Jobs, 4.8% Unemployment Rate (Graphs included)
From the BLS:
Total nonfarm payroll employment increased by 227,000 in January, and the unemployment rate was little changed at 4.8 percent, the U.S. Bureau of Labor Statistics reported today. Job gains occurred in retail trade, construction, and financial activities.
...
The change in total nonfarm payroll employment for November was revised down from +204,000 to +164,000, and the change for December was revised up from +156,000 to +157,000. With these revisions, employment gains in November and December combined were 39,000 lower than previously reported.
...
In January, average hourly earnings for all employees on private nonfarm payrolls rose by 3 cents to $26.00, following a 6-cent increase in December. Over the year, average hourly earnings have risen by 2.5 percent.
...
[Annual Benchmark Revision] The total nonfarm employment level for March 2016 was revised downward by 60,000 (-81,000 on a not seasonally adjusted basis, or -0.1 percent). ... The effect of these revisions on the underlying trend in nonfarm payroll employment was minor.
emphasis added
 Click on graph for larger image.
The first graph shows the monthly change in payroll jobs, ex-Census (meaning the impact of the decennial Census temporary hires and layoffs is removed - mostly in 2010 - to show the underlying payroll changes).
Total payrolls increased by 227 thousand in January (private payrolls increased 237 thousand).
Payrolls for November and December were revised down by a combined 39 thousand.
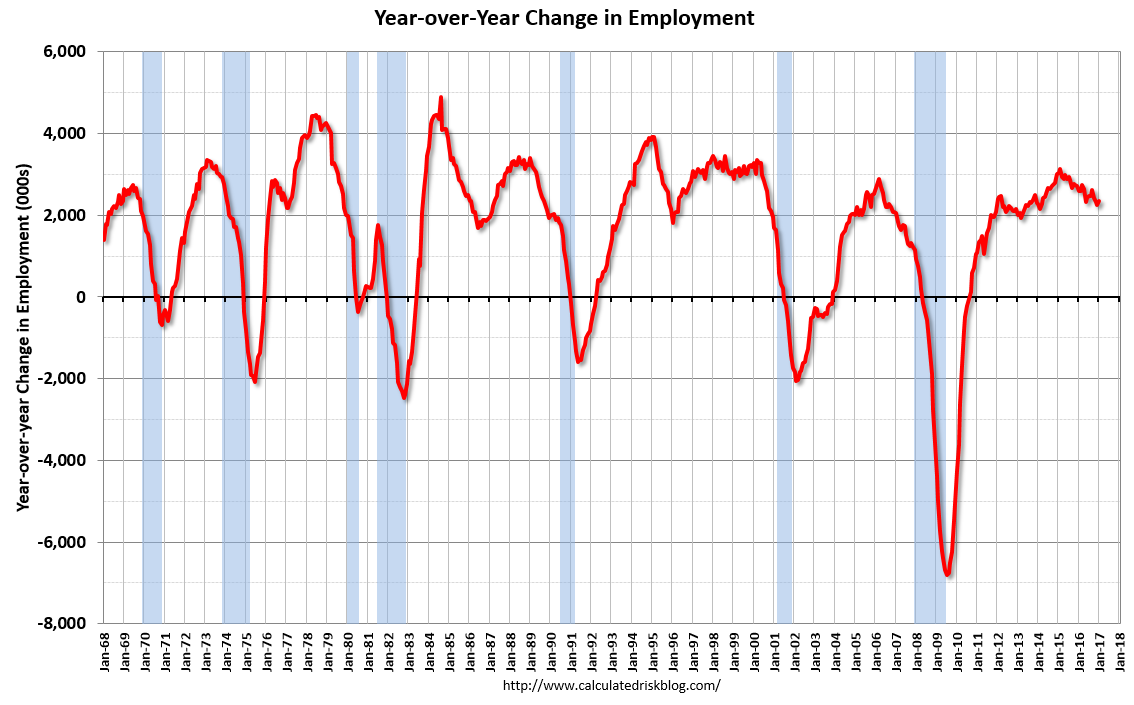 This graph shows the year-over-year change in total non-farm employment since 1968.
In January, the year-over-year change was 2.34 million jobs. This is a solid year-over-year gain.
The third graph shows the employment population ratio and the participation rate.
 The Labor Force Participation Rate increased in January to 62.9%. This is the percentage of the working age population in the labor force. A large portion of the recent decline in the participation rate is due to demographics.
 The Employment-Population ratio was increased to 59.9% (black line).
I'll post the 25 to 54 age group employment-population ratio graph later.
 The fourth graph shows the unemployment rate.
 The unemployment rate increased in January to 4.8%.
This was above expectations of 175,000 jobs, however the previous two months were revised down. Another solid report.
I'll have much more later ...


