 RSS Feed
 by Calculated Risk on 8/05/2016 12:30:00 PM
Friday, August 05, 2016
Trade Deficit at $44.5 Billion in June
Earlier from the Department of Commerce reported:
The U.S. Census Bureau and the U.S. Bureau of Economic Analysis, through the Department of Commerce, announced today that the goods and services deficit was $44.5 billion in June, up $3.6 billion from $41.0 billion in May, revised. June exports were $183.2 billion, $0.6 billion more than May exports. June imports were $227.7 billion, $4.2 billion more than May imports.The trade deficit was larger than the consensus forecast of $43.0 billion.
The first graph shows the monthly U.S. exports and imports in dollars through June 2016.
 Click on graph for larger image.
Imports and exports increased in June.
Exports are 10% above the pre-recession peak and down 4% compared to June 2015; imports are down 2% compared to June 2015.
It appears trade might be picking up a little.
The second graph shows the U.S. trade deficit, with and without petroleum.
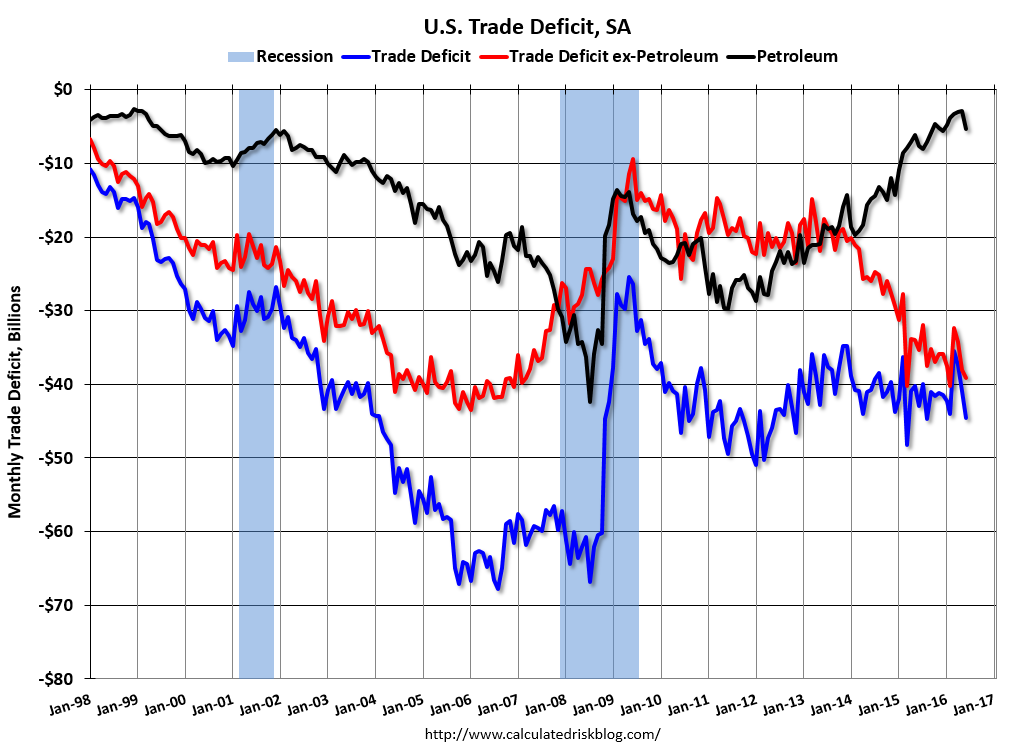 The blue line is the total deficit, and the black line is the petroleum deficit, and the red line is the trade deficit ex-petroleum products.
Oil imports averaged $39.38 in June, up from $34.19 in April, and down from $53.76 in June 2015. The petroleum deficit has generally been declining and is the major reason the overall deficit has declined a little since early 2012.
The trade deficit with China decreased to $29.8 billion in June, from $31.8 billion in June 2015. The deficit with China is a substantial portion of the overall deficit.


