 RSS Feed
 by Calculated Risk on 3/01/2016 09:29:00 AM
Tuesday, March 01, 2016
CoreLogic: House Prices up 6.9% Year-over-year in January
Notes: This CoreLogic House Price Index report is for January. The recent Case-Shiller index release was for December. The CoreLogic HPI is a three month weighted average and is not seasonally adjusted (NSA).
From CoreLogic: CoreLogic US Home Price Report Shows Home Prices Up 6.9 Percent Year Over Year in January 2016
Home prices nationwide, including distressed sales, increased year over year by 6.9 percent in January 2016 compared with January 2015 and increased month over month by 1.3 percent in January 2016 compared with December 2015, according to the CoreLogic HPI.
...
“While the national market continues to steadily improve, the contours of the home price recovery are shifting,” said Dr. Frank Nothaft, chief economist for CoreLogic. “The northwest and Rocky Mountain states have experienced greater appreciation and account for four of the top five states for home price growth.”
emphasis added
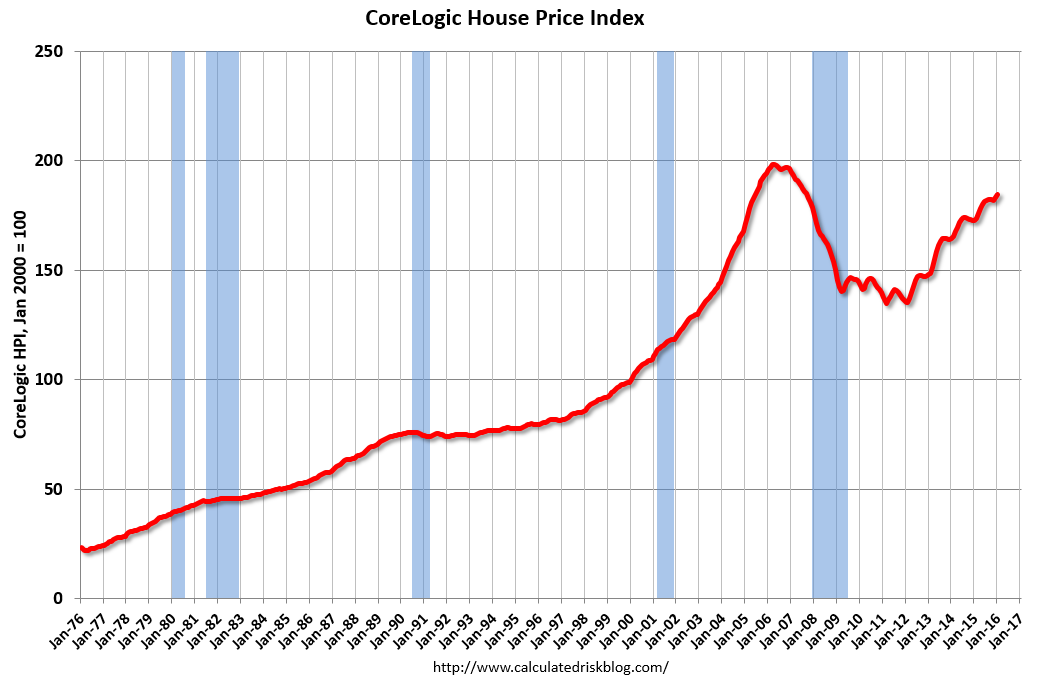 Click on graph for larger image.
 This graph shows the national CoreLogic HPI data since 1976. January 2000 = 100.
The index was up 1.3% in January (NSA), and is up 6.9% over the last year.
This index is not seasonally adjusted, and this was a solid month-to-month increase.
The second graph shows the YoY change in nominal terms (not adjusted for inflation).
 The YoY increase had been moving sideways over the last year, but has picked up a recently.
The year-over-year comparison has been positive for forty seven consecutive months.


