 RSS Feed
 by Calculated Risk on 2/05/2016 02:00:00 PM
Friday, February 05, 2016
Comments: A Solid Employment Report
My initial reaction was this was a "decent" employment report. However, with some further analysis, I think this should be characterized as a "solid" report.
The unemployment rate declined to 4.9% even as the participation rate increased (a strong household survey). Sure the headline number was below the consensus forecast, but this follows several months of above trend job gains (job gains averaged 279 thousand over the previous three months).
With current demographics, the unemployment rate would decline with job gains under 100 thousand, so 151 thousand is still solid.
And another positive sign is that wage growth picked up and was above the consensus forecast. From the BLS: "In January, average hourly earnings for all employees on private nonfarm payrolls increased by 12 cents to $25.39. Over the year, average hourly earnings have risen by 2.5 percent."
Earlier: January Employment Report: 151,000 Jobs, 4.9% Unemployment Rate (Graphs Included)
A few more numbers: Total employment is now 4.9 million above the previous peak. Total employment is up 13.6 million from the employment recession low.
Private payroll employment increased 158,000 in December, and private employment is now 5.2 million above the previous peak. Private employment is up 14.0 million from the recession low.
In January, the year-over-year change was 2.67 million jobs.
Employment-Population Ratio, 25 to 54 years old
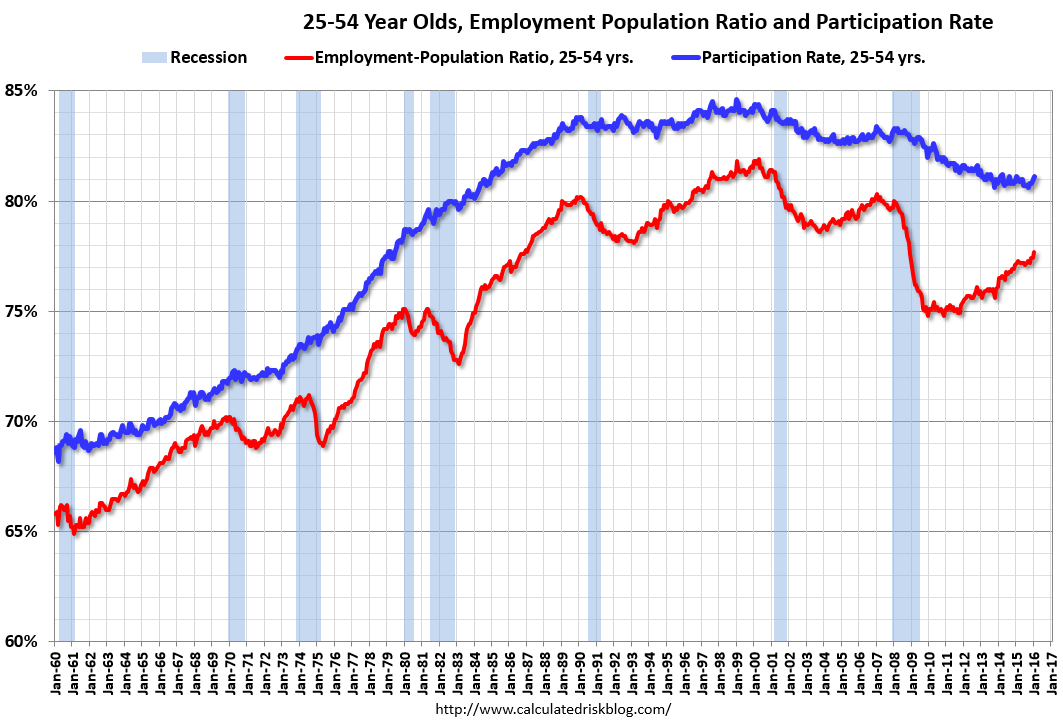 Since the overall participation rate has declined recently due to cyclical (recession) and demographic (aging population, younger people staying in school) reasons, here is the employment-population ratio for the key working age group: 25 to 54 years old.
In the earlier period the participation rate for this group was trending up as women joined the labor force. Since the early '90s, the participation rate moved more sideways, with a downward drift starting around '00 - and with ups and downs related to the business cycle.
The 25 to 54 participation rate increased in January to 81.1%, and the 25 to 54 employment population ratio increased to 77.7%. The participation rate for this group might increase a little more (or at least stabilize for a couple of years) - although the participation rate has been trending down for this group since the late '90s.
Average Hourly Earnings
 This graph is based on “Average Hourly Earnings” from the Current Employment Statistics (CES) (aka "Establishment") monthly employment report. Note: There are also two quarterly sources for earnings data: 1) “Hourly Compensation,” from the BLS’s Productivity and Costs; and 2) the Employment Cost Index which includes wage/salary and benefit compensation.
The graph shows the nominal year-over-year change in "Average Hourly Earnings" for all private employees. Nominal wage growth was at 2.5% YoY in January - and although the series is noisy - wage growth is trending up.
This was stronger than most forecasts and is a sign the labor market is tightening.
Note: CPI has been running under 2%, so there has been real wage growth.
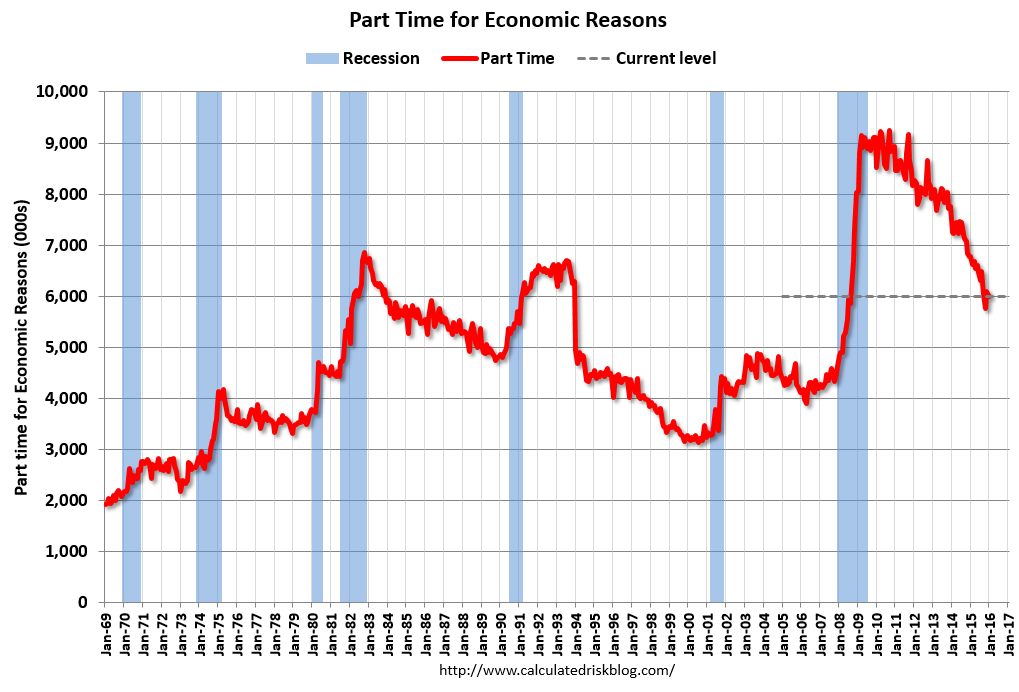
Part Time for Economic Reasons
 From the BLS report:
The number of persons employed part time for economic reasons (sometimes referred to as involuntary part-time workers) was little changed at 6.0 million in January but was down by 796,000 over the year. These individuals, who would have preferred full-time employment, were working part time because their hours had been cut back or because they were unable to find full-time jobs.The number of persons working part time for economic reasons was little changed in January. This level suggests slack still in the labor market.
These workers are included in the alternate measure of labor underutilization (U-6) that was unchanged at 9.9% in January.
Unemployed over 26 Weeks
 This graph shows the number of workers unemployed for 27 weeks or more.
 According to the BLS, there are 2.09 million workers who have been unemployed for more than 26 weeks and still want a job. This was up from 2.08 million in December.
This is generally trending down, but is still high.
There are still signs of slack (as example, part time workers for economic reasons and elevated U-6), but there also signs the labor market is tightening (wages and U-3). Overall this was a solid employment report.


