by Calculated Risk on 1/21/2016 03:20:00 PM
Thursday, January 21, 2016
Private Investment and the Business Cycle
The following is an update to a few graphs and analysis that I started posting in 2005. In 2005 I was bearish on residential investment, and I used these graphs to argue that the then coming housing bust would lead the economy into a recession. Now this analysis is suggesting more growth ... (note: Some of this discussion is updated from previous posts).
Discussions of the business cycle frequently focus on consumer spending (PCE: Personal consumption expenditures), but the key is to watch private domestic investment, especially residential investment. Even though private investment usually only accounts for around 15% of GDP, the swings for private investment are significantly larger than for PCE during the business cycle, so private investment has an outsized impact on GDP at transitions in the business cycle.
The first graph shows the real annualized change in GDP and private investment since 1976 through Q3 2016 (this is a 3 quarter centered average to smooth the graph).
GDP has fairly small annualized changes compared to the huge swings in investment, especially during and just following a recession. This is why investment is one of the keys to the business cycle.

Note that during the recent recession, the largest decline for GDP was in Q4 2008 (a 8.2% annualized rate of decline). On a three quarter center averaged basis (as presented on graph), the largest decline was 5.2% annualized.
However the largest decline for private investment was a 39% annualized rate! On a three quarter average basis (on graph), private investment declined at a 31% annualized rate.
The second graph shows the contribution to GDP from the five categories of private investment: residential investment, equipment and software, nonresidential structures, intellectual property and "Change in private inventories". Note: this is a 3 quarter centered average of the contribution to GDP.
This is important to follow because residential investment tends to lead the economy, equipment and software is generally coincident, and nonresidential structure investment lags the business cycle. Red is residential, green is equipment and software, and blue is investment in non-residential structures. The usual pattern - both into and out of recessions is - red, green, and blue.

The key leading sector - residential investment - lagged the recent recovery because of the huge overhang of existing inventory. Usually residential investment is a strong contributor to GDP growth and employment in the early stages of a recovery, but not this time - and that weakness was a key reason why the recovery was sluggish.
Residential investment turned positive in 2011, and made a positive contribution to GDP through 2015.

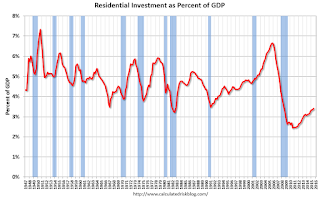
The third graph shows residential investment as a percent of GDP. Residential investment as a percent of GDP is still very low, and it seems likely that residential investment as a percent of GDP will increase further in 2016.
Nothing is perfect, but residential investment suggests further growth. Add in the improvement in household balance sheets, some contribution from Federal, state and local governments, and a further increase in non-residential structures in 2016 (ex-energy) - and the economy should continue to grow.


