by Calculated Risk on 4/16/2015 02:54:00 PM
Thursday, April 16, 2015
Comments on March Housing Starts
March was another disappointing month for housing start.
In February, it was easy to blame the weather, especially in the Northeast where starts plunged and then bounced back in March. However, in March, the weakness was more in the South and West (maybe related to oil prices in Texas and the drought in California).
Note: It is also possible that the West Coast port slowdown impacted starts a little in March. The labor situation was resolved in February, and any impact should disappear quickly.

This graph shows the month to month comparison between 2014 (blue) and 2015 (red).
Even with two weak months, starts are still running about 5% ahead of 2014 through March.
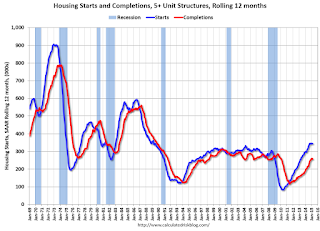
Below is an update to the graph comparing multi-family starts and completions. Since it usually takes over a year on average to complete a multi-family project, there is a lag between multi-family starts and completions. Completions are important because that is new supply added to the market, and starts are important because that is future new supply (units under construction is also important for employment).
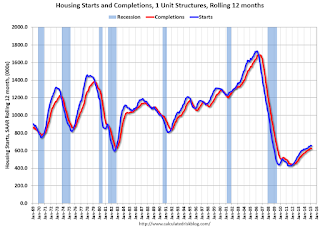
These graphs use a 12 month rolling total for NSA starts and completions.

The rolling 12 month total for starts (blue line) increased steadily over the last few years, and completions (red line) have lagged behind - but completions have been catching up (more deliveries), and will continue to follow starts up (completions lag starts by about 12 months).
Note that the blue line (multi-family starts) might be starting to move more sideways.
I think most of the growth in multi-family starts is probably behind us - although I expect solid multi-family starts for a few more years (based on demographics).

Note the exceptionally low level of single family starts and completions. The "wide bottom" was what I was forecasting several years ago, and now I expect several years of increasing single family starts and completions.


