by Calculated Risk on 5/06/2013 08:38:00 AM
Monday, May 06, 2013
LPS: New Problem Loans at Lowest Rate in 6 Years; Negative Equity Drops
LPS released their Mortgage Monitor report for March today. According to LPS, 6.59% of mortgages were delinquent in March, down from 6.80% in February.
LPS reports that 3.37% of mortgages were in the foreclosure process, down from 4.19% in March 2012.
This gives a total of 9.96% delinquent or in foreclosure. It breaks down as:
• 1,842,000 properties that are 30 or more days, and less than 90 days past due, but not in foreclosure.
• 1,466,000 properties that are 90 or more days delinquent, but not in foreclosure.
• 1,689,000 loans in foreclosure process.
For a total of 4,997,000 loans delinquent or in foreclosure in March. This is down from 5,589,000 in March 2012.

The first graph from LPS shows the number of non-current loans by delinquency bucket (30-60 days, 60-90 days, 90+ days, and in-foreclosure). The number of problem loans fell below 5 million for the first time since 2008.
Also note that short term delinquencies are close to normal - and LPS reports new problem loans are at the lowest level in 6 years - but there still 3 million loans that are 90+ days delinquent or in-foreclosure. This is still very high.

The March Mortgage Monitor report released by Lender Processing Services found that new problem loan rates (seriously delinquent mortgages that were current six months ago) have fallen below 1 percent for the first time since 2007. At 0.84 percent, the March new problem loan rate is approaching pre-crisis levels, and nearing the conditions of 2000-2004 when the rate averaged 0.55 percent. However, as LPS Applied Analytics Senior Vice President Herb Blecher explained, a borrower’s equity position is still a key indicator of his or her propensity to default.There is much more in the mortgage monitor.
“There has always been a clear correlation between higher levels of negative equity and new problem loan rates,” Blecher said. “Looking at the March data, we see that borrowers with equity are actually outperforming the national average -- at 0.6 percent, this group is quite close to pre-crisis norms. The further underwater a borrower gets, the higher those problem rates rise. Borrowers with loan-to-value (LTV) ratios of just 100-110 percent are actually defaulting at more than twice the national average. For those 50 percent or more underwater, we see new problem rates of 4 percent.
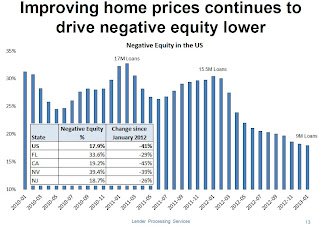
“Still, the overall equity trend has been a very positive one,” Blecher continued. “LPS’ latest data shows that the share of loans with LTVs greater than 100 percent has fallen 41 percent from a year ago. In total, there were approximately 9 million such loans, or about 18 percent of active mortgages. Some states, including the so-called ‘sand states’ (Arizona, Florida, Nevada and California), are still well above the national level, at an average 28 percent, but they, too, have seen improvement over the last year, with negative equity dropping over 40 percent across those four states since January 2012.”


