by Calculated Risk on 3/28/2013 05:01:00 PM
Thursday, March 28, 2013
Comments on Q4 GDP and Investment
The third estimate of Q4 GDP report was released this morning, and although GDP was revised up, growth was still very weak at a 0.4% annualized real rate in Q4. Personal consumption expenditures (PCE) were at a 1.8% annualized real growth rate; the third consecutive quarter with a sub 2% growth rate.
There were two significant drags on GDP in Q4, the changes in private inventories subtracted 1.52 percentage points, and government spending subtracted 1.41 percentage points. Inventories will probably rebound in Q1, but government spending (especially at the Federal level) will remain under pressure all year.
Overall this was a weak report, but with some underlying positives especially related to investment (a leading indicator). The following graph shows the contribution to GDP from residential investment, equipment and software, and nonresidential structures (3 quarter centered average). This is important to follow because residential investment tends to lead the economy, equipment and software is generally coincident, and nonresidential structure investment trails the economy.
For the following graph, red is residential, green is equipment and software, and blue is investment in non-residential structures. So the usual pattern - both into and out of recessions is - red, green, blue.
The dashed gray line is the contribution from the change in private inventories.
 Click on graph for larger image.
Residential Investment (RI) made a positive contribution to GDP in Q4 for the seventh consecutive quarter. Usually residential investment leads the economy, but that didn't happen this time because of the huge overhang of existing inventory, but now RI is contributing. The good news: Residential investment has clearly bottomed.
The ongoing positive contribution from RI to GDP is a significant story.
Equipment and software investment increased solidly in Q4, after decreasing in Q3. This followed twelve consecutive quarters with a positive contribution.
The contribution from nonresidential investment in structures was revised to a positive in Q4. Nonresidential investment in structures typically lags the recovery, however investment in energy and power has masked the ongoing weakness in office, mall and hotel investment (the underlying details will be released next week).
The increase in investment is a key positive looking forward.
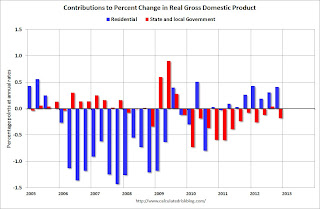
The second graph shows the contribution to percent change in GDP for residential investment and state and local governments since 2005.
 The blue bars are for residential investment (RI), and RI was a significant drag on GDP for several years. Now RI has added to GDP growth for the last 7 quarters (through Q4 2012).
However the drag from state and local governments is ongoing. Although not as large a negative as the worst of the housing bust (and much smaller spillover effects), this decline in state and local government spending has been relentless and unprecedented. I expect the drag from state and local governments to end, but the drag from Federal spending will be ongoing.
The key story is that residential investment is continuing to increase, and I expect this to continue. The change in private inventories will rebound in Q1, and I expect GDP to be closer to 3% this quarter. Since RI is the best leading indicator for the economy, this suggests no recession this year or in 2014 (with the usual caveats about Europe and policy errors in the US).


