by Calculated Risk on 2/14/2013 03:02:00 PM
Thursday, February 14, 2013
FNC: Residential Property Values increased 4.9% year-over-year in December
In addition to Case-Shiller, CoreLogic, FHFA and LPS, I'm also watching the FNC, Zillow and several other house price indexes.
From FNC: FNC Index: U.S. Home Prices Hit Two-Year High
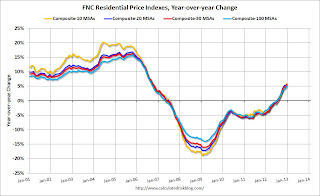
The latest FNC Residential Price Index™ (RPI) shows continuing momentum in the U.S. housing market with home prices rising to a two-year high in December. Despite an unexpected deceleration in economic growth, the ongoing housing recovery has maintained its pace with steady gains in home prices, sending the index up 5.4% year to date. ...The year-over-year change continued to increase in December, with the 100-MSA composite up 4.9% compared to December 2011. The FNC index turned positive on a year-over-year basis in July, 2012, and that was the first year-over-year increase in the FNC index since year-over-year prices started declining in early 2007 (over five years ago).
A stabilizing foreclosure market is contributing to the recovery of the underlying property values. While challenges remain for many hard-hit markets, particularly those undergoing a judicial process for home foreclosures, there are signs that foreclosure prices have bottomed out—the first encouraging development in the long housing recession where a rising underlying market and stabilizing foreclosure prices co-exist. Foreclosures as a percentage of total home sales were 17.8% in December, down from 24.0% a year ago.
Based on recorded sales of non-distressed properties (existing and new homes) in the 100 largest metropolitan areas, the FNC 100-MSA composite index shows that December home prices remained relatively unchanged from the previous month, but were up 4.9% on a year-over-year basis from the same period in 2011. ... The 30-MSA and 10-MSA composite indices show similar trends of continued price momentum, relatively unchanged from November and up 5.8% from December 2011.
Half of the component markets tracked by the FNC 30-MSA composite index show rising prices in December. ... Although signs of a housing recovery are widening, the degree of market improvement is inconsistent across the country. In Baltimore, Chicago, Houston, and San Antonio, prices were relatively flat over the last 12 months (year-to-year change). In contrast, Phoenix and Denver saw a double-digit growth, led by Phoenix at nearly 23%. The Chicago market continues to underperform other major cities that make up the FNC 30-MSA composite index. The city’s home prices were up only 1.0% on a year-over-year basis, compared to an average of 5.0% among the nation’s largest cities.
 Click on graph for larger image.
This graph shows the year-over-year change for the FNC Composite 10, 20, 30 and 100 indexes. Note: The FNC indexes are hedonic price indexes using a blend of sold homes and real-time appraisals.
The key is the indexes are now showing a year-over-year increase indicating prices probably bottomed early in 2012.


