by Calculated Risk on 12/15/2012 08:24:00 AM
Saturday, December 15, 2012
Summary for Week ending Dec 14th
The key US economic story of the week was the FOMC announcement of thresholds for raising the Fed Funds rate based on the unemployment rate and inflation. Also the FOMC expanded QE3 by an additional $45 billion per month starting in January (some people are calling it QE4, but that isn't consistent - the FOMC expanded an earlier QE). This was a significant change in Fed communication, and the change allows the FOMC to drop the date language from the FOMC statement. If the economy improves quicker than the forecast, then investors will adjust their estimate of timing (or the opposite). The Fed also made it very clear they will tolerate a little more inflation in the near term.
The economic data showed some bounce back following Hurricane Sandy. The retail report increased 0.3% (less than forecast though), and industrial production increase 1.1% (more than forecast). And initial weekly unemployment claims continued to decline following the Sandy spike.
This bounce back shows the declines in October were storm related.
The austerity debate (aka "Fiscal cliff) still showing no signs of progress. But I don't expect agreement until early January (although it could happen sooner). Next week will be very busy with several key housing reports.
Here is a summary of last week in graphs:
• Retail Sales increased 0.3% in November
 Click on graph for larger image.
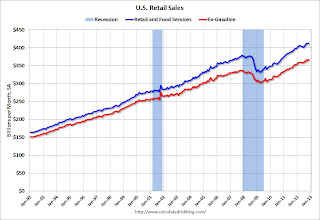
On a monthly basis, retail sales increased 0.3% from October to November (seasonally adjusted), and sales were up 3.7% from November 2011. The change in sales for October was unrevised at a 0.3% decline.
This graph shows retail sales since 1992. This is monthly retail sales and food service, seasonally adjusted (total and ex-gasoline).
Retail sales are up 24.5% from the bottom, and now 8.8% above the pre-recession peak (not inflation adjusted)
 The second graph shows the year-over-year change in retail sales and food service (ex-gasoline) since 1993.
Retail sales ex-gasoline increased by 4.0% on a YoY basis (3.7% for all retail sales).
This was at the consensus forecast of no change ex-autos, but below the consensus forecast for total retail sales of a 0.6% increase in November. Retail sales are still sluggish, but generally trending up.
• Trade Deficit increased in October to $42.2 Billion
 The Dept of Commerce reported: "[T]otal October exports of $180.5 billion and imports of $222.8 billion resulted in a goods and services deficit of $42.2 billion, up from $40.3 billion in September, revised. October exports were $6.8 billion less than September exports of $187.3 billion. October imports were $4.9 billion less than September imports of $227.6 billion."
Both exports and imports decreased in October. US trade has slowed recently.
Exports are 9% above the pre-recession peak and up 1.0% compared to October 2011; imports are 4% below the pre-recession peak, and down 0.8% compared to October 2011.
 The second graph shows the U.S. trade deficit, with and without petroleum, through October.
The blue line is the total deficit, and the black line is the petroleum deficit, and the red line is the trade deficit ex-petroleum products.
Oil averaged $99.75 in October, up from $98.88 per barrel in September. The trade deficit with China increased to $29.5 billion in October, up from $28.1 billion in October 2011. Most of the trade deficit is still due to oil and China.
The trade deficit with the euro area was $8.9 billion in October, up from $7.1 billion in October 2011. It appears the eurozone recession is impacting trade.
• Industrial Production increased 1.1% in November, Bounces back following Hurricane Sandy
 From the Fed: "Industrial production increased 1.1 percent in November after having fallen 0.7 percent in October. The gain in November is estimated to have largely resulted from a recovery in production for industries that had been negatively affected by Hurricane Sandy, which hit the Northeast region in late October."
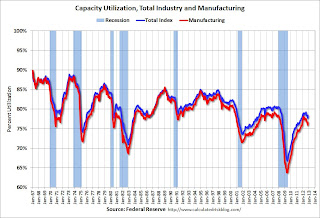
This graph shows Capacity Utilization. This series is up 11.6 percentage points from the record low set in June 2009 (the series starts in 1967).
Capacity utilization at 78.4% is still 1.9 percentage points below its average from 1972 to 2010 and below the pre-recession level of 80.6% in December 2007.
 The second graph shows industrial production since 1967.
Industrial production increased in November to 97.5. This is 17% above the recession low, but still 3.2% below the pre-recession peak.
IP was above expectations due to the bounce back following Hurricane Sandy. Overall IP has only up 2.5% year-over-year.
• Key Measures show low inflation in November
The Cleveland Fed released the median CPI and the trimmed-mean CPI.
 This graph shows the year-over-year change for four key measures of inflation. On a year-over-year basis, the median CPI rose 2.2%, the trimmed-mean CPI rose 1.9%, the CPI rose 1.8%, and the CPI less food and energy rose 1.9%. Core PCE is for October and increased 1.7% year-over-year.
On a monthly basis, median CPI was above the Fed's target at 2.3% annualized. However trimmed-mean CPI was at 1.6% annualized, and core CPI increased 1.4% annualized. Also core PCE for October increased 1.6% annualized. These measures suggest inflation is mostly below the Fed's target of 2% on a year-over-year basis.
The Fed's focus will probably be on core PCE and core CPI, and both are at or below the Fed's target on year-over-year basis. Also, the FOMC statement this week indicated the Fed will tolerate an inflation outlook "between one and two years ahead" of 2 1/2 percent. So, with this low level of inflation and the current high level of unemployment, the Fed will keep the "pedal to the metal".
• BLS: Job Openings "little changed" in October
 This graph shows job openings (yellow line), hires (dark blue), Layoff, Discharges and other (red column), and Quits (light blue column) from the JOLTS.
 Notice that hires (dark blue) and total separations (red and light blue columns stacked) are pretty close each month. This is a measure of turnover. When the blue line is above the two stacked columns, the economy is adding net jobs - when it is below the columns, the economy is losing jobs.
Jobs openings increased in October to 3.675 million, up from 3.547 million in September. The number of job openings (yellow) has generally been trending up, and openings are up about 8% year-over-year compared to October 2011.
Quits increased in October, and quits are up 4% year-over-year. These are voluntary separations. (see light blue columns at bottom of graph for trend for "quits"). The trend suggests a gradually improving labor market.
• Weekly Initial Unemployment Claims decline to 343,000
 The dashed line on the graph is the current 4-week average. The four-week average of weekly unemployment claims declined to 381,500.
The recent sharp increase in the 4 week average was due to Hurricane Sandy as claims increased significantly in NY, NJ and other impacted areas. Now, as expected, the 4-week average is almost back to the pre-storm level.
Weekly claims were lower than the 370,000 consensus forecast.
Note: We use the 4-week average to smooth out noise, but following an event like Hurricane Sandy, the 4-week average lags the event. It looks like the average should decline next week to around 370,000 or so.


