 RSS Feed
 by Calculated Risk on 11/06/2012 11:30:00 AM
Tuesday, November 06, 2012
CoreLogic: House Price Index declined seasonally in September, Up 5.0% Year-over-year
Notes: This CoreLogic House Price Index report is for September. The recent Case-Shiller index release was for August. Case-Shiller is currently the most followed house price index, however CoreLogic is used by the Federal Reserve and is followed by many analysts. The CoreLogic HPI is a three month weighted average and is not seasonally adjusted (NSA).
From CoreLogic: CoreLogic® September Home Price Index Rises 5 Percent Year-Over-Year
Home prices nationwide, including distressed sales, increased on a year-over-year basis by 5 percent in September 2012 compared to September 2011. This change represents the biggest increase since July 2006 and the seventh consecutive increase in home prices nationally on a year-over-year basis. On a month-over-month basis, including distressed sales, home prices decreased by 0.3 percent in September 2012 compared to August 2012.
...
Excluding distressed sales, home prices nationwide also increased on a year-over-year basis by 5 percent in September 2012 compared to September 2011. On a month-over-month basis excluding distressed sales, home prices increased 0.5 percent in September 2012 compared to August 2012, the seventh consecutive month-over-month increase. Distressed sales include short sales and real estate owned (REO) transactions.
The CoreLogic Pending HPI indicates that October 2012 home prices, including distressed sales, are expected to rise by 5.7 percent on a year-over-year basis from October 2011 and fall by 0.5 percent on a month-over-month basis from September 2012 as sales exhibit a seasonal slowdown going into the winter.
...
“Home price improvement nationally continues to outpace our expectations, growing 5 percent year-over-year in September, the best showing since July 2006,” said Mark Fleming, chief economist for CoreLogic. “While prices on a month-over-month basis are declining, as expected in the housing off-season, most states are exhibiting price increases. Gains are particularly large in former housing bubble states and energy-industry concentrated states."
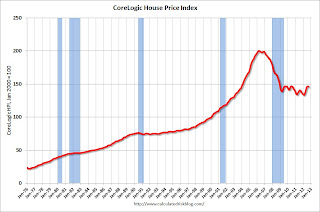 Click on graph for larger image.
 This graph shows the national CoreLogic HPI data since 1976. January 2000 = 100.
The index was down 0.3% in September, and is up 5.0% over the last year.
The index is off 26.9% from the peak - and is up 9.7% from the post-bubble low set in February (the index is NSA, so some of the increase is seasonal).
 The second graph is from CoreLogic. The year-over-year comparison has been positive for seven consecutive months suggesting house prices bottomed earlier this year on a national basis (the bump in 2010 was related to the tax credit).
This is the largest year-over-year increase since 2006.
Since this index is not seasonally adjusted, it was expected to decline on a month-to-month basis in September, and will probably stay negative on a month-to-month basis until the March 2013 report is released. The key for the next several months will be to watch the year-over-year change.


