by Calculated Risk on 10/10/2012 05:50:00 PM
Wednesday, October 10, 2012
CoStar: Commercial Real Estate prices increase in August
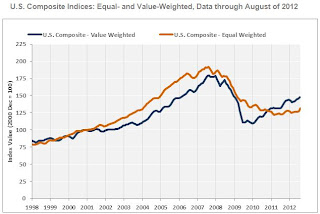
The two broadest measures of aggregate pricing for commercial properties within the CCRSI — the U.S. Value-Weighted Composite Index and the U.S. Equal-Weighted Composite Index — each posted significant gains in August 2012.
The U.S. Value-Weighted Composite Index, which weights each repeat-sale by transaction size or value and therefore is heavily influenced by larger transactions, reached its highest level since early 2009. It has now improved by a cumulative 34.1% since the start of 2010, reflecting strong investor demand for primary gateway metro areas and institutional-grade multifamily assets that have been at the forefront of the pricing recovery for commercial property.
The rate of improvement in the U.S. Equal-Weighted Composite Index, which weights each repeat-sale equally and therefore reflects the influence of the more numerous smaller transactions, has accelerated. The 7.6% year-over–year increase of the Equal-Weighted Composite Index in August 2012 was the largest such gain since August 2006. Despite the increase, cumulative gains in the Equal-Weighted Index have lagged behind those in the Value-Weighted Index, reflecting a slower rate of recovery of tenant demand in the General Commercial segment.
Aggregate net absorption of available space for three major property types—office, retail, and industrial—slowed during the third quarter of 2012 to less than one third of levels in the second quarter of 2012 and less than half of that in the first quarter of this year. The slowdown in leasing activity stems mainly from negative absorption in the General Commercial segment. Should this drawback in tenant demand be sustained by further macroeconomic weakness, near-term transaction volume and pricing could suffer.
The percentage of commercial property selling at distressed prices in August 2012 was the lowest since mid-2009.
 Click on graph for larger image.
This graph from CoStar shows the Value-Weighted and Equal-Weighted indexes. As CoStar noted, the Value-Weighted index is up 34.1% from the bottom (showing the demand for higher end properties), however the Equal-Weighted index is only up 8.2% from the bottom.
Note: These are repeat sales indexes - like Case-Shiller for residential - but this is based on far fewer pairs.


