by Calculated Risk on 9/07/2012 05:32:00 PM
Friday, September 07, 2012
AAR: Rail Traffic "mixed" in August, Building related commodities were up
Once again rail traffic was "mixed". However building related commodities were up such as lumber and crushed stone, gravel, sand. Lumber was up 21% from August 2011.
From the Association of American Railroads (AAR): AAR Reports Mixed Weekly Rail Traffic for August
The Association of American Railroads (AAR) today reported U.S. rail carloads originated in August 2012 totaled 1,461,680, down 1.4 percent compared with August 2011. Intermodal traffic in August 2012 totaled 1,230,992 containers and trailers, up 51,145 units or 4.3 percent compared with August 2011. The August 2012 average weekly intermodal volume of 246,198 units is the second highest average for any August on record.
...
“U.S rail traffic in August was pretty much same song, different verse,” said AAR Senior Vice President John T. Gray. “Weakness in coal carloadings was largely but not entirely offset by increases in carloads of petroleum and petroleum products, autos, lumber, and several other commodities, with intermodal showing continued strength.”
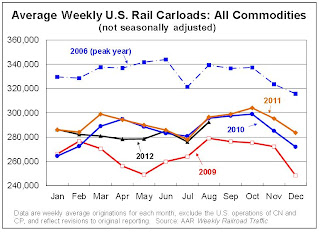
 Click on graph for larger image.
This graph shows U.S. average weekly rail carloads (NSA).
On a non-seasonally adjusted basis, U.S. rail carload traffic fell 1.4% (21,050 carloads) in August 2012 from August 2011. Carloads totaled 1,461,680 for the month, an average of 292,336 per week, which is the highest weekly average since November 2011. It was the seventh straight year-over-year monthly decline.The second graph is for intermodal traffic (using intermodal or shipping containers):
Commodities with carload gains on U.S. railroads in August 2012 included petroleum and petroleum products (up 18,007 carloads, or 49.0%); motor vehicle and parts (up 8,966 carloads, or 13.0%); and crushed stone, sand, and gravel (up 6,905 carloads, or 7.3%). Carloads of lumber and wood products were up 21.3% (2,877 carloads) in August 2012; carloads of grain were up 1.7%.
Coal continues to suffer, with U.S. carloadings down 7.3% (48,493 carloads) in August 2012 from August 2011
 Graphs reprinted with permission.
Intermodal traffic is now near peak levels.
U.S. intermodal traffic rose 4.3% (51,145 containers and trailers) in August 2012 over August 2011 on a non-seasonally adjusted basis, totaling 1,230,992 units for the month. The weekly average in August 2012 was 246,198, the second highest for an August in history.The top months for intermodal are usually in the fall, and it looks like intermodal traffic will be at or near record levels this year.
This is more evidence of sluggish growth - and of residential investment making a positive contribution.
Earlier on employment:
• August Employment Report: 96,000 Jobs, 8.1% Unemployment Rate
• Employment: Another Weak Report (more graphs)
• All Employment Graphs


