by Calculated Risk on 6/25/2012 12:18:00 PM
Monday, June 25, 2012
Home Sales Reports: What Matters
After the existing home sales report for May was released last week, I saw several cautionary comments focused on the decline in sales in May (from 4.62 million in April to 4.55 million in May). The key number in the existing home sales report is not sales, but inventory. It is visible inventory that impacts prices (although the "shadow" inventory will keep prices from rising).
When we look at sales for existing homes, the focus should be on the composition between conventional and distressed. Total sales are probably close to the normal level of turnover, but the composition of sales is far from normal - sales are still heavily distressed sales. Over time, existing home sales will probably settle around 5 million per year, but the percentage of distressed sales will eventually decline. Those looking at the number of existing home sales for a recovery in housing are looking at the wrong number. Look at inventory and the percent of conventional sales.
However, for the new home sales report, the key number is sales! An increase in sales adds to both GDP and employment (completed inventory is at record lows, so any increase in sales will translate to more single family starts).
It might be hard to believe, but earlier this year there was a debate on whether housing had bottomed. That debate is over - clearly new home sales have bottomed – and the debate is now about the strength of the recovery. Although sales are still historically very weak, sales are up 35% from the low, and up about 24% from the May 2010 through September 2011 average.
Some people think housing will recover rapidly to the 1.2+ million rate we saw in 2004 and 2005. I think that is incorrect for two reasons. First, I think the recovery will be sluggish - 2012 will probably be the third worst year ever. Second, the 1.2 million in annual sales was due to an increasing homeownership rate and speculative buying. With a stable homeownerhip rate, and little speculative buying, sales will probably only rise to around 800 thousand at full recovery.
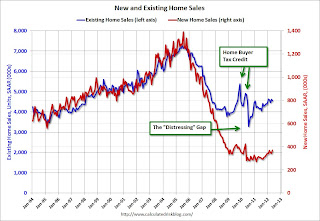
With existing home sales around 5 million per year, and new home sales around 800 thousand per year, the “distressing gap” in the graph below will be closed.
 Click on graph for larger image in graph gallery.
This "distressing gap" graph that shows existing home sales (left axis) and new home sales (right axis) through May. This graph starts in 1994, but the relationship has been fairly steady back to the '60s.
Following the housing bubble and bust, the "distressing gap" appeared mostly because of distressed sales. The flood of distressed sales has kept existing home sales elevated, and depressed new home sales since builders haven't been able to compete with the low prices of all the foreclosed properties.
This gap will eventually close, but it will probably take a number of years.
Note: Existing home sales are counted when transactions are closed, and new home sales are counted when contracts are signed. So the timing of sales is different.
Earlier:
• New Home Sales increase in May to 369,000 Annual Rate
• New Home Sales graphs


