by Calculated Risk on 6/19/2012 01:39:00 PM
Tuesday, June 19, 2012
Comments on Housing and Article on Yahoo
Over on Yahoo today: McBride: Total Housing Starts Decline in May, but the Trend Is Positive
Here are some more thoughts ...
For the housing industry, the recovery has started. As I've noted before, the debate is now about the strength of the recovery, not whether there is a recovery. My view is housing will remain sluggish for some time, and I expect 2012 to be another weak year, but better than 2011.
Economist Michelle Meyer at Merrill Lynch, who remains cautious on housing, wrote the following this morning:
We look for residential investment to increase 8% in Q2, following the 19% pop in Q1. This will add 0.2pp to GDP growth in the quarter. Assuming similar gains in the second half of the year, real residential investment should be up 10% this year, adding 0.2pp to annual GDP growth. This is the first annual contribution since before the housing bubble burst in 2006.The question about house prices is not as clear. Although I think prices have bottomed for the national repeat sales indexes, others are more pessimistic. As an example, from RadarLogic this morning:
... Although housing demand is improving ... it is still slow and many potential homebuyers are restricted due to tight credit. Moreover, homebuilders are continuing to compete with the overhang of distressed inventory in many markets. The gain in homebuilding is about relative strength - multifamily building (to satisfy the increase in renters) and single family construction in non-distressed markets.
Radar Logic also contends that there is a grave risk that economic forces outside the housing market will deliver a significant blow to housing demand. Given the excess supply in the market, such a reduction in demand could in turn result in another precipitous decline in housing prices.I think this is an argument for little or no increase in house prices, not for an additional "precipitous decline".
The excess supply consists of homes that are currently on the market as well as homes that are not currently for sale but could enter the market when home prices start to strengthen. As home prices start to firm, home owners who are eager to sell but have been unable or unwilling to do so at prior price levels will put their homes on the market. The increase in supply will cut off price appreciation and, to the extent that the newly unleashed supply exceeds demand, push down home prices.
Here is an update to the graph comparing multi-family starts and completions. Since it usually takes over a year on average to complete a multi-family project, there is a lag between multi-family starts and completions. Completions are important because that is new supply added to the market, and starts are important because that is future new supply (units under construction is also important for employment).
These graphs use a 12 month rolling total for NSA starts and completions.
 Click on graph for larger image.
The blue line is for multifamily starts and the red line is for multifamily completions.
The rolling 12 month total for starts (blue line) has been increasing since mid-2010. The 12 month total for starts is steadily increasing, and completions (red line) is lagging behind - but completions will following starts up over the course of the year (completions lag starts by about 12 months).
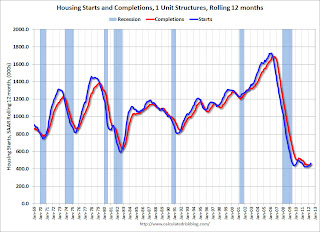
 This second graph shows single family starts and completions. It usually only takes about 6 months between starting a single family home and completion - so the lines are much closer. The blue line is for single family starts and the red line is for single family completions.
 For the fourth consecutive month, the rolling 12 month total for starts has been above completions. This usually only happens at a bottom, although the recovery for single family starts will probably remain sluggish.


