by Calculated Risk on 4/02/2012 12:09:00 PM
Monday, April 02, 2012
Construction Spending declines in February
Catching up ... This morning the Census Bureau reported that overall construction spending declined in February:
The U.S. Census Bureau of the Department of Commerce announced today that construction spending during February 2012 was estimated at a seasonally adjusted annual rate of $808.9 billion, 1.1 percent (±1.3%)* below the revised January estimate of $818.1 billion. The February figure is 5.8 percent (±1.8%) above the February 2011 estimate of $764.2 billion.Private construction spending was also declined in February:
Spending on private construction was at a seasonally adjusted annual rate of $527.3 billion, 0.8 percent (±1.1%)* below the revised January estimate of $531.7 billion. Residential construction was at a seasonally adjusted annual rate of $246.5 billion in February, nearly the same as (±1.3%)* the revised January estimate of $246.4 billion. Nonresidential construction was at a seasonally adjusted annual rate of $280.8 billion in February, 1.6 percent (±1.1%) below the revised January estimate of $285.3 billion.
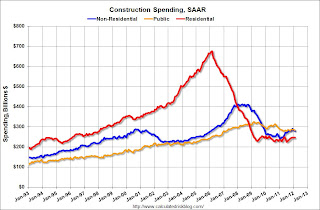
 Click on graph for larger image.
This graph shows private residential and nonresidential construction spending, and public spending, since 1993. Note: nominal dollars, not inflation adjusted.
Private residential spending is 63.5% below the peak in early 2006, and up 10% from the recent low. Non-residential spending is 32% below the peak in January 2008, and up about 15% from the recent low.
Public construction spending is now 13% below the peak in March 2009.
 The second graph shows the year-over-year change in construction spending.
On a year-over-year basis, both private residential and non-residential construction spending are positive, but public spending is down slightly on a year-over-year basis. The year-over-year improvements in private non-residential are mostly due to energy spending (power and electric).
The year-over-year improvement in private residential investment is an important change (the positive in 2010 was related to the tax credit), and this suggest the bottom is in for residential investment.


