by Calculated Risk on 4/24/2012 02:49:00 PM
Tuesday, April 24, 2012
Comments on Housing and "Distressing Gap" Graph
The solid new home sales report this morning is further confirmation that the recovery for the housing industry has started. New home sales are up about 17% from the weakest three month period during the housing bust. That is a significant improvement, even if the absolute levels are still very low.
The debate is now about the strength of the recovery, not whether there is a recovery. My view is housing will remain sluggish for some time, and I expect 2012 to be another historically weak year, but better than 2011.
For house prices, the Case-Shiller index has a serious lag, and the key right now is to see if the year-over-year change is declining (it is). Note: The current Case-Shiller report was an average of December, January and February closing prices, and some of those sales were probably negotiated last October, about six months ago!
More current, but less reliable, pricing data (such as asking prices, new home prices and some anecdotal comments) suggest that house prices have stopped falling in most areas, and I expect the year-over-year change in the Case-Shiller index to turn slightly positive in the not too distant future (it is difficult to predict when, although I'll try in a couple of months). Of course the number of REO sales (lender Real Estate Owned) are down, and some of the improvement is related to fewer foreclosures and other distressed sales.
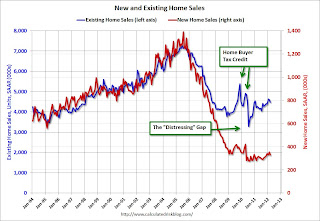
Here is an update to the "distressing gap" graph that shows existing home sales (left axis) and new home sales (right axis) through March. This graph starts in 1994, but the relationship has been fairly steady back to the '60s.
 Click on graph for larger image.
Following the housing bubble and bust, the "distressing gap" appeared mostly because of distressed sales. The flood of distressed sales has kept existing home sales elevated, and depressed new home sales since builders haven't been able to compete with the low prices of all the foreclosed properties.
I expect this gap to eventually close, but it will probably take a number of years.
Note: Existing home sales are counted when transactions are closed, and new home sales are counted when contracts are signed. So the timing of sales is different.
On March New Home Sales:
• New Home Sales in March at 328,000 Annual Rate
• New Home Sales graphs
On House Prices:
• Case Shiller: House Prices fall to new post-bubble lows in February NSA
• Real House Prices and Price-to-Rent Ratio at late '90s Levels
• House Price graphs


