by Calculated Risk on 3/31/2012 08:05:00 AM
Saturday, March 31, 2012
Summary for Week ending March 30th
Last week S&P reported that the Case-Shiller house price index fell to a new post-bubble low in January. However it is important to remember that the Case-Shiller index has a significant lag to current pricing.
The report last week was for a three month average for house sales recorded in November, December and January, and sales are usually recorded a couple of months after the purchase agreement is signed. For a house that closed in November, the purchase agreement was probably signed in September or early October. So some portion of the just reported Case-Shiller index was for contract prices over 6 months ago!
Even the most recent portion of the index (for January) is probably for contracts signed in November or early December. A significant lag was fine when we expected prices to just keep on falling, but for those of us now looking for an inflection point for house prices, the Case-Shiller index will only tell us well after the event.
Other data was mixed last week. Three regional Fed manufacturing surveys showed slower expansion in March, the Chicago PMI declined, and pending home sales were down in February.
On the other hand, personal spending increased in February, consumer sentiment improved, and weekly initial unemployment continued to trend down.
Overall mixed and still sluggish growth.
Here is a summary in graphs:
• Case Shiller: House Prices fall to new post-bubble lows in January
S&P/Case-Shiller released the monthly Home Price Indices for January (a 3 month average of November, December and January).
 Click on graph for larger image.
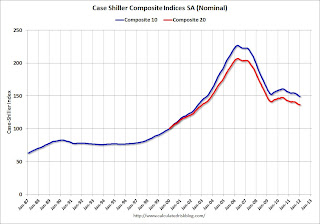
The first graph shows the nominal seasonally adjusted Composite 10 and Composite 20 indices (the Composite 20 was started in January 2000).
The Composite 10 index is off 34.2% from the peak, and down 0.1% in January (SA). The Composite 10 is at a new post bubble low (both Seasonally adjusted and Not Seasonally Adjusted).
The Composite 20 index is off 33.9% from the peak, and unchanged in January (SA) from December. The Composite 20 is also at a new post-bubble low.
 The second graph shows the Year over year change in both indices.
The Composite 10 SA is down 3.8% compared to January 2011.
The Composite 20 SA is down 3.8% compared to January 2011. This was a slightly smaller year-over-year decline for both indexes than in December.
The third graph shows the price declines from the peak for each city included in S&P/Case-Shiller indices.
 Prices increased (SA) in 9 of the 20 Case-Shiller cities in January seasonally adjusted (only 3 cities increased NSA). Prices in Las Vegas are off 61.8% from the peak, and prices in Dallas only off 8.6% from the peak. There was no data for Charlotte in January.
Both the SA and NSA are at new post-bubble lows - and the NSA indexes will continue to decline for the next couple of months (this report was for the three months ending in January).
• Real House Prices and Price-to-Rent Ratio decline to late '90s Levels
Case-Shiller, CoreLogic and others report nominal house prices. It is also useful to look at house prices in real terms (adjusted for inflation) and as a price-to-rent ratio.
 This graph shows the CoreLogic, Case-Shiller Composite 20, and Case-Shiller National indexes in real terms (adjusted for inflation using CPI less Shelter).
 In real terms, the National index is back to Q4 1998 levels, the Composite 20 index is back to February 2000, and the CoreLogic index back to August 1999.
In October 2004, Fed economist John Krainer and researcher Chishen Wei wrote a Fed letter on price to rent ratios: House Prices and Fundamental Value. Kainer and Wei presented a price-to-rent ratio using the OFHEO house price index and the Owners' Equivalent Rent (OER) from the BLS.
 Here is a similar graph using the Case-Shiller National, Composite 20 and CoreLogic House Price Indexes.
This graph shows the price to rent ratio (January 1998 = 1.0).
On a price-to-rent basis, the Case-Shiller National index is back to October 1998 levels, the Composite 20 index is back to February 2000 levels, and the CoreLogic index is back to August 1999.
• Weekly Initial Unemployment Claims decline to 359,000
The following graph shows the 4-week moving average of weekly claims since January 2000.
 The DOL reports "In the week ending March 24, the advance figure for seasonally adjusted initial claims was 359,000, a decrease of 5,000 from the previous week's revised figure of 364,000. The 4-week moving average was 365,000, a decrease of 3,500 from the previous week's revised average of 368,500." Note: "This week's release reflects the annual revision to the weekly unemployment claims seasonal adjustment factors. The seasonal adjustment factors used for the UI Weekly Claims data from 2007 forward, along with the resulting seasonally adjusted values for initial claims and continuing claims, have been revised."
The dashed line on the graph is the current 4-week average. The four-week average of weekly unemployment claims declined to 365,000 (after annual revisions).
The 4-week moving average is at the lowest level since early 2008 (including revisions).
• Regional Fed Manufacturing Surveys
Three regional Fed surveys were released last week: Richmond, Dallas and Kansas City. All three showed slightly slower expansion in March.
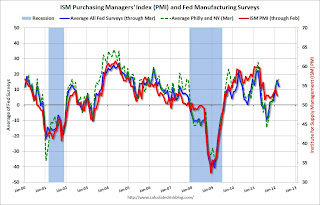
 Here is a graph comparing the regional Fed surveys and the ISM manufacturing index:
The New York and Philly Fed surveys are averaged together (dashed green, through March), and five Fed surveys are averaged (blue, through March) including New York, Philly, Richmond, Dallas and Kansas City. The Institute for Supply Management (ISM) PMI (red) is through February (right axis).
• Personal Income increased 0.2% in February, Spending 0.8%
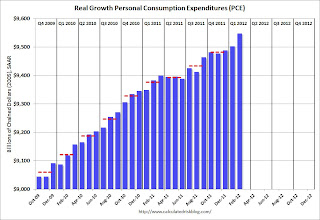
The following graph shows real Personal Consumption Expenditures (PCE) through February (2005 dollars).
 PCE increased 0.8% in February, and real PCE increased 0.5%. January was revised up from unchanged to a 0.2% increase.
 Note: The PCE price index, excluding food and energy, increased 0.1 percent. The personal saving rate was at 3.7% in February.
This was a sharp increase in spending in February (and January spending was revised up). Using the two-month method, it appears real PCE will increase around 2.0% in Q1 (PCE is the largest component of GDP); the mid-month method suggests an increase closer to 2.9%.
• Consumer Sentiment improves in March
 The final Reuters / University of Michigan consumer sentiment index for March increased to 76.2, up from the preliminary reading of 74.3, and up from the February reading of 75.3.
This was above the consensus forecast of an increase to 74.7. Overall sentiment is still fairly weak, although sentiment has rebounded from the decline last summer and is near the high since collapsing in late 2007 and early 2008.
• Other Economic Stories ...
• Chicago PMI declines to 62.2
• From the NAR: Pending Home Sales Ease in February but Solidly Higher Than a Year Ago
• From ATA: ATA Truck Tonnage Increased 0.5% in February
• Restaurant Performance Index increases in February


