by Calculated Risk on 3/21/2012 06:12:00 PM
Wednesday, March 21, 2012
CoreLogic: Existing Home Shadow Inventory remains at 1.6 million units
Note: there are different measures of "shadow" inventory. CoreLogic tries to add up the number of properties that are seriously delinquent, in the foreclosure process, and already REO (lender Real Estate Owned) that are NOT currently listed for sale. Obviously if a house is listed for sale, it is already included in the "visible supply" and cannot be counted as shadow inventory.
From CoreLogic: CoreLogic® Reports Shadow Inventory as of January 2012 Remains Flat
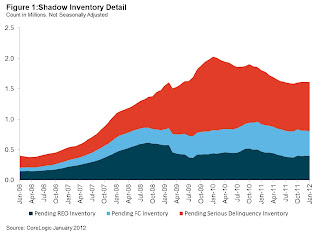
CoreLogic ... reported today that the current residential shadow inventory as of January 2012 was 1.6 million units (6-months’ supply), approximately the same level reported in October 2011. On a year-over-year basis, shadow inventory was down from January 2011, when it stood at 1.8 million units, or 8-months’ supply. Currently, the flow of new seriously delinquent (90 days or more) loans into the shadow inventory has been offset by the roughly equal flow of distressed sales (short and real estate owned).
“Almost half of the shadow inventory is not yet in the foreclosure process,” said Mark Fleming, chief economist for CoreLogic. “Shadow inventory also remains concentrated in states impacted by sharp price declines and states with long foreclosure timelines.”
...
CoreLogic estimates the current stock of properties in the shadow inventory, also known as pending supply, by calculating the number of distressed properties not currently listed on multiple listing services (MLSs) that are seriously delinquent, in foreclosure and real estate owned (REO) by lenders.
...
Of the 1.6 million properties currently in the shadow inventory, 800,000 units are seriously delinquent (3.1-months’ supply), 410,000 are in some stage of foreclosure (1.6-months’ supply) and 400,000 are already in REO (1.6-months’ supply).
 Click on graph for larger image.
This graph from CoreLogic shows the breakdown of "shadow inventory" by category. More from CoreLogic:
The highest concentration of shadow inventory is for loans with loan balances between $100,000 and $125,000. More importantly while the overall supply of homes in the shadow inventory is declining versus a year ago, the declines are being driven by higher balance loans. For loans with balances of $75,000 or less, however, the shadow is still growing and is up 3 percent from a year ago.So the key number in this report is that as of January, there were 1.6 million homes seriously delinquent, in the foreclosure process or REO that are not currently listed for sale.
...
Florida, California and Illinois account for more than a third of the shadow inventory. The top six states, which would also include New York, Texas and New Jersey, account for half of the shadow inventory.
The shadow inventory is approximately four times higher than its low point (380,000 properties) at the peak of the housing bubble in mid-2006.
Note: The unlisted REO still seems a little high since total REO has dropped sharply over the last couple of quarters.
Earlier:
• Existing Home Sales in February: 4.59 million SAAR, 6.4 months of supply
• Existing Home Sales: Inventory and NSA Sales Graph
• Existing Home Sales graphs


